6.3. Analysing proportions
The binomial test
2025-11-18
Properties of the binomial distribution
Expected # successes of n trials
Expected successes in \(n\) trials
\[\Huge{\mu = n \times p}\]
\(\mu\): That’s right. Mean number of successes, aka, expected number of successes.
Binomial: Variability and Uncertainty
For counts:
\[\text{population variance: } \sigma^2 = n \times p \times(1-p)\]
\[\text{sample variance: }s^2 = n\times \hat p \times(1-\hat p)\]
Properties of proportions: expectations
If there are \(X\) successes in \(n\) trials in a random sample, then the
estimated proportion of successes is:
\[\hat p = \frac{X}{n}\]
\(\hat p\): The hat signals that this is an estimate
\(p\): The expected proportion of successes is the probability of success p
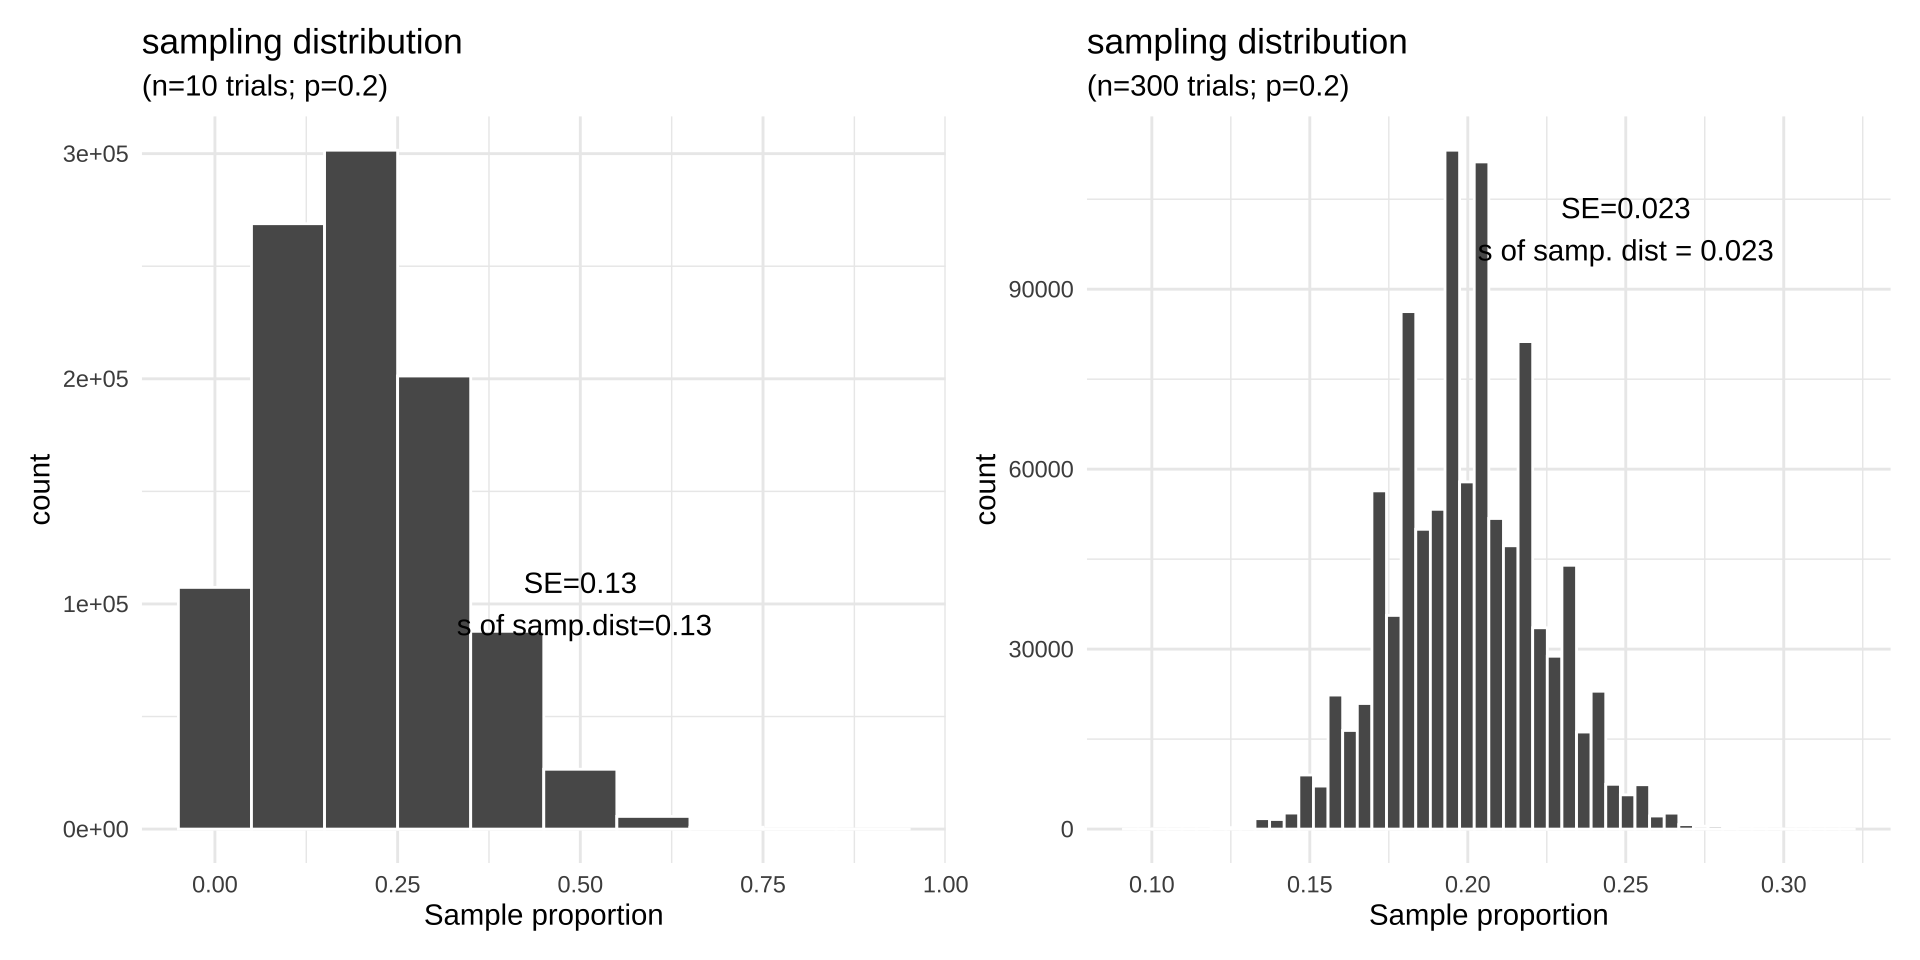
Sample size and standard error
Properties of Proportions: Variability
| Variance | \(\sigma^2=p(1-p)\) | |
| Standard deviation | \(\sigma=\sqrt(p(1-p))\) | |
| Sample variance | \(s^2=\hat p(1-\hat p)\) | |
| Sample standard deviation | \(s=\sqrt{\hat p(1-\hat p)}\) |
Standard error of a proportion
Recall: the standard error of an estimate is always the standard deviation of its sampling distribution. If we know the real \(p\) we can calculate it as:
\[\sigma_{\hat p}=\sqrt{\frac{p(1-p)}{n}}\]
Because \(p\) is usually unknown, in practice we have:
\[s_{\hat p}=\sqrt{\frac{\hat p(1-\hat p)}{n}}\]
95% CIs for a proportion (1/)
- For many parameter values, the binomial distribution is not symmetric about its mean. This is one reason why the 2 SE rule of thumb does not work for this.
- The 95% confidence interval of a proportion will enclose the true value of the proportion 95% of the time that it is calculated from new data.
- There are many ways to approximate the 95% CI of a proportion, and no consensus[1].
95% CIs for a proportion (2/)
- The book suggests the Agresti-Coull CIs:
\[\bigg(p' - 1.96 \sqrt{\frac{p'(1-p')}{n+4}}\bigg) \leq p \leq \bigg(p' + 1.96 \sqrt{\frac{p'(1-p')}{n+4}}\bigg)\]
\(p' = (X+2) / (n+4)\)… where \(X =\) observed # of successes
Approximations for the Binomial Test
Why?
• Adding up all the probabilities to obtain the exact p- value is pretty time-consuming
• Because of that, two approximations for the p-value of a binomial test exist: the chi-square goodness-of-fit test (next topic) and the normal approximation to the binomial test
• They can be useful and are very common.
• In R you can implement the exact binomial test easily, though, as we saw
Key Points
• A proportion is an estimate of a probability.
• The binomial distribution provides a clear example of building up from simple probability logic to mathematical models of probability.
• The binomial test tests the null hypothesis that an estimated proportion comes from a population with a specified probability.
• We can quantify the uncertainty in our estimate of the probability.
Interactive App: https://shiny.rit.albany.edu/stat/binomial/
B215: Biostatistics with R