2.1.Displaying & Describing Data

Measures of central tendency and spread

Bárbara D. Bitarello

2025-09-15

Outline

  • Estimates of location
  • Estimates of width
  • Explanatory and exploratory figures
  • Best practices in figure design
  • How data types drive figure design
  • How to make effective tables

Learning Goals

  • Differentiate between estimates of location and estimates of width.
  • Recognize that variability is not simply noise, but is a key parameter that can be estimated.
  • Become familiar with the most common descriptive statistics.
  • Know when the mean or median is a more appropriate summary of location.
  • Distinguish between explanatory and exploratory figures.
  • Identify what makes a good graph.
  • Understand how data types drive figure design.
  • Understand how to make effective tables.

Frequency vs. Probability Distribution

Frequency Distribution

  • sample
  • a snapshot of actual counts of outcomes in a given sample

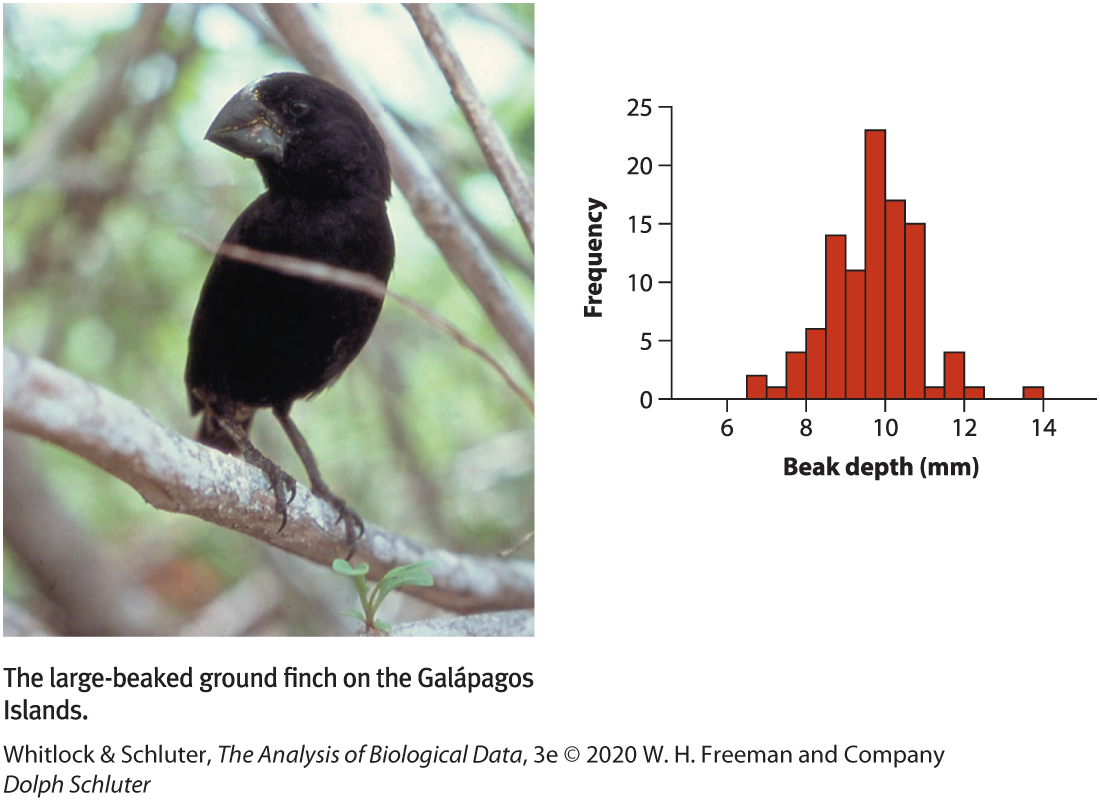
Probably Distribution

  • population
  • usually not known so based on probability rules: it represents the theoretical probability of all possible outcomes of a random variable

Descriptive Statistics

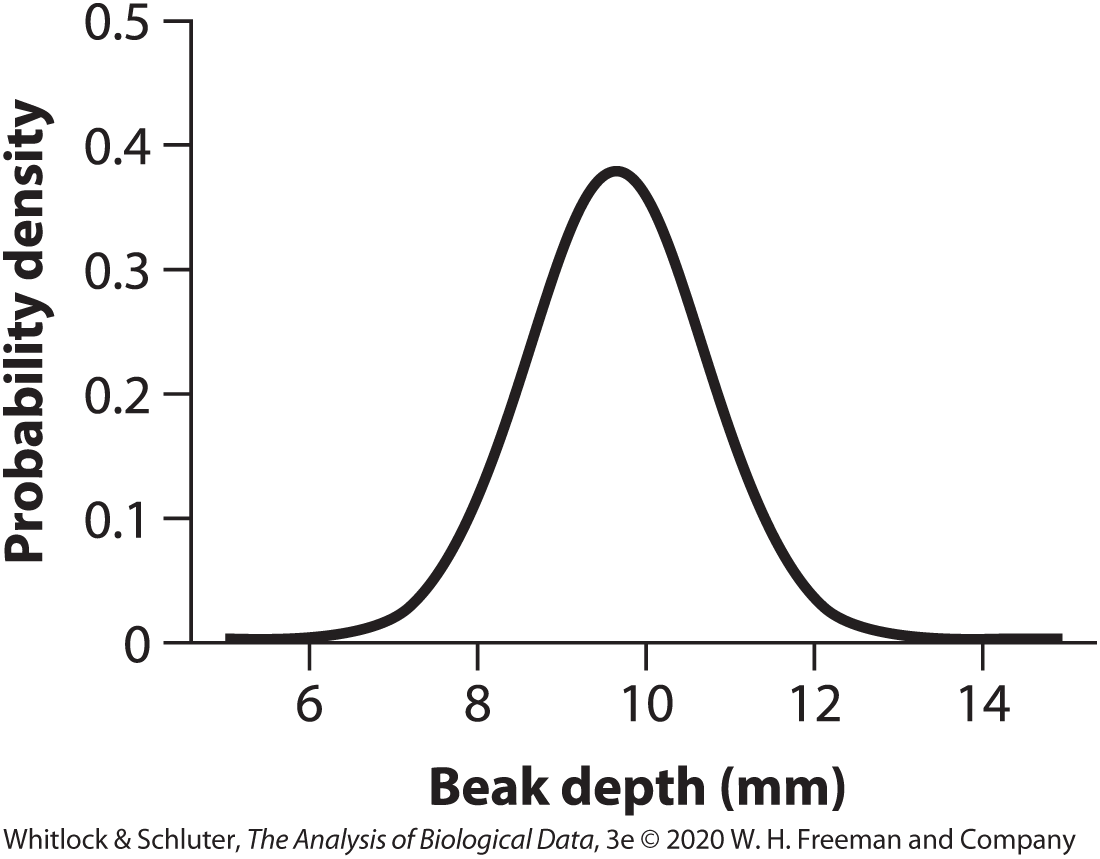
Or summary statistics: quantities that capture important features of frequency distributions

Three Common Descriptions of Data

  • Location (central tendency)

  • Width (spread)

  • Association (correlation)

Measures of location (central tendency)

Measures of location

  • Mean: The weight of your data. The average value.

  • Median: A “typical individual”. If I take an individual at random, this is the value we expect them to be closest to.

  • Mode: The typical individual most common value for an individual. The most likely answer for an individual selected at random.

The average problem

“Average” is often used synonymously with mean.

  • But: medians and even modes are sometimes called an “average”.

  • When you see the word, “average”, pay attention to which measure of location it describes.

(Arithmetic) Mean

The sum of values divided by the sample size.

\[\bar{Y}=\frac{\sum_{i=1}^{n}Y_{i}}{n}\]

  • \(\bar{Y}\) is the mean value of variable \(Y\)
  • \(\sum\) signified “sum”
  • \(n\) is the number of individuals in the samples (sample size)
  • \(Y_{i}\) is the observed value for the \(i\)-th individual

Example: The mean of the set of 11 numbers: \(1, 15,9, 16,6, 17, 10, 5, 12, 14, 13\) is

\(\bar{Y} = 1+15+9+16+6+17+10+5+12+14+13/11 = 106.1818\)

Practice: Mean from a frequency table

  • Frequency tables show the number of times, \(n_{i}\) a value, \(Y_{i}\), is observed in a sample of size \(n_{total}\)

  • We calculate the mean from a frequency table by summing the product of \(n_{i}\) and \(Y_{i}\) all values and diving by \(n_{total}\).

convictions frequency
0 265
1 49
2 21
3 19
4 10
5 10
6 2
7 2
8 4
9 2
10 1
11 4
12 3
13 1
14 2

A frequency table. Data from Farrington (1994) and distributed at http://www.webapp.icpsr.umich.edu/cocoon/NACJD-STUDY/08488.xml.

Practice: Mean from a frequency table

  • Frequency tables show the number of times, \(n_{i}\) a value, \(Y_{i}\), is observed in a sample of size \(n_{total}\)
Code
convictions <- c(0, 1, 2, 3, 4,
    5, 6, 7, 8, 9, 10, 11, 12,
    13, 14)
freqs <- c(265, 49, 21, 19, 10,
    10, 2, 2, 4, 2, 1, 4, 3, 1,
    2)
n_total <- sum(freqs)  # 395
  • We calculate the mean from a frequency table by summing the product of \(n_{i}\) and \(Y_{i}\) across all values and diving by \(n_{total}\).
Code
# multiply two vectors of
# same length

FinalMean <- sum(convictions *
    freqs)/n_total
FinalMean
[1] 1.126582
A frequency table
convictions frequency ConvictionxFreq
0 265 0
1 49 49
2 21 42
3 19 57
4 10 40
5 10 50
6 2 12
7 2 14
8 4 32
9 2 18
10 1 10
11 4 44
12 3 36
13 1 13
14 2 28

Median

The value halfway through an ordered list of observations.

  • The \((n + 1) / 2\)-th value for odd sized samples.
  • Mean of n/2 th and the \((n + 2) / 2\)-th value for even sized samples.

Example: Using the same set of numbers as before (try):

  • First, order the numbers: \(1, 5, 6, 9, 10, 12, 13, 14, 15, 16, 17\)
  • The \((n + 1) / 2\)-th value for odd sized samples: \(12\)

Mean and Median in R

Code
# a vector with the numbers
mynumbers <- c(1, 15, 9, 16, 6, 17, 10, 5, 12, 14, 13)
# mean 'manually'
mysum <- sum(mynumbers)  #sum all numbers
l <- length(mynumbers)  #number of elements in vector
mymean <- mysum/l
mymean
[1] 10.72727
Code
# note that you can use a built-in function for this:
mymean2 <- mean(mynumbers)
mymean2
[1] 10.72727
Code
# median with built-in function
mymedian <- median(mynumbers)
mymedian
[1] 12
Code
# median 'manually'
mynumbers2 <- sort(mynumbers)
mynumbers2
 [1]  1  5  6  9 10 12 13 14 15 16 17
Code
# since l = 11 (odd) we select the l+1-th element, i.e, (11+1)/2=6
mynumbers2[6]
[1] 12

That’s all for today

Forrest says "And that's all I wanted to say about that"

From: makeameme.org