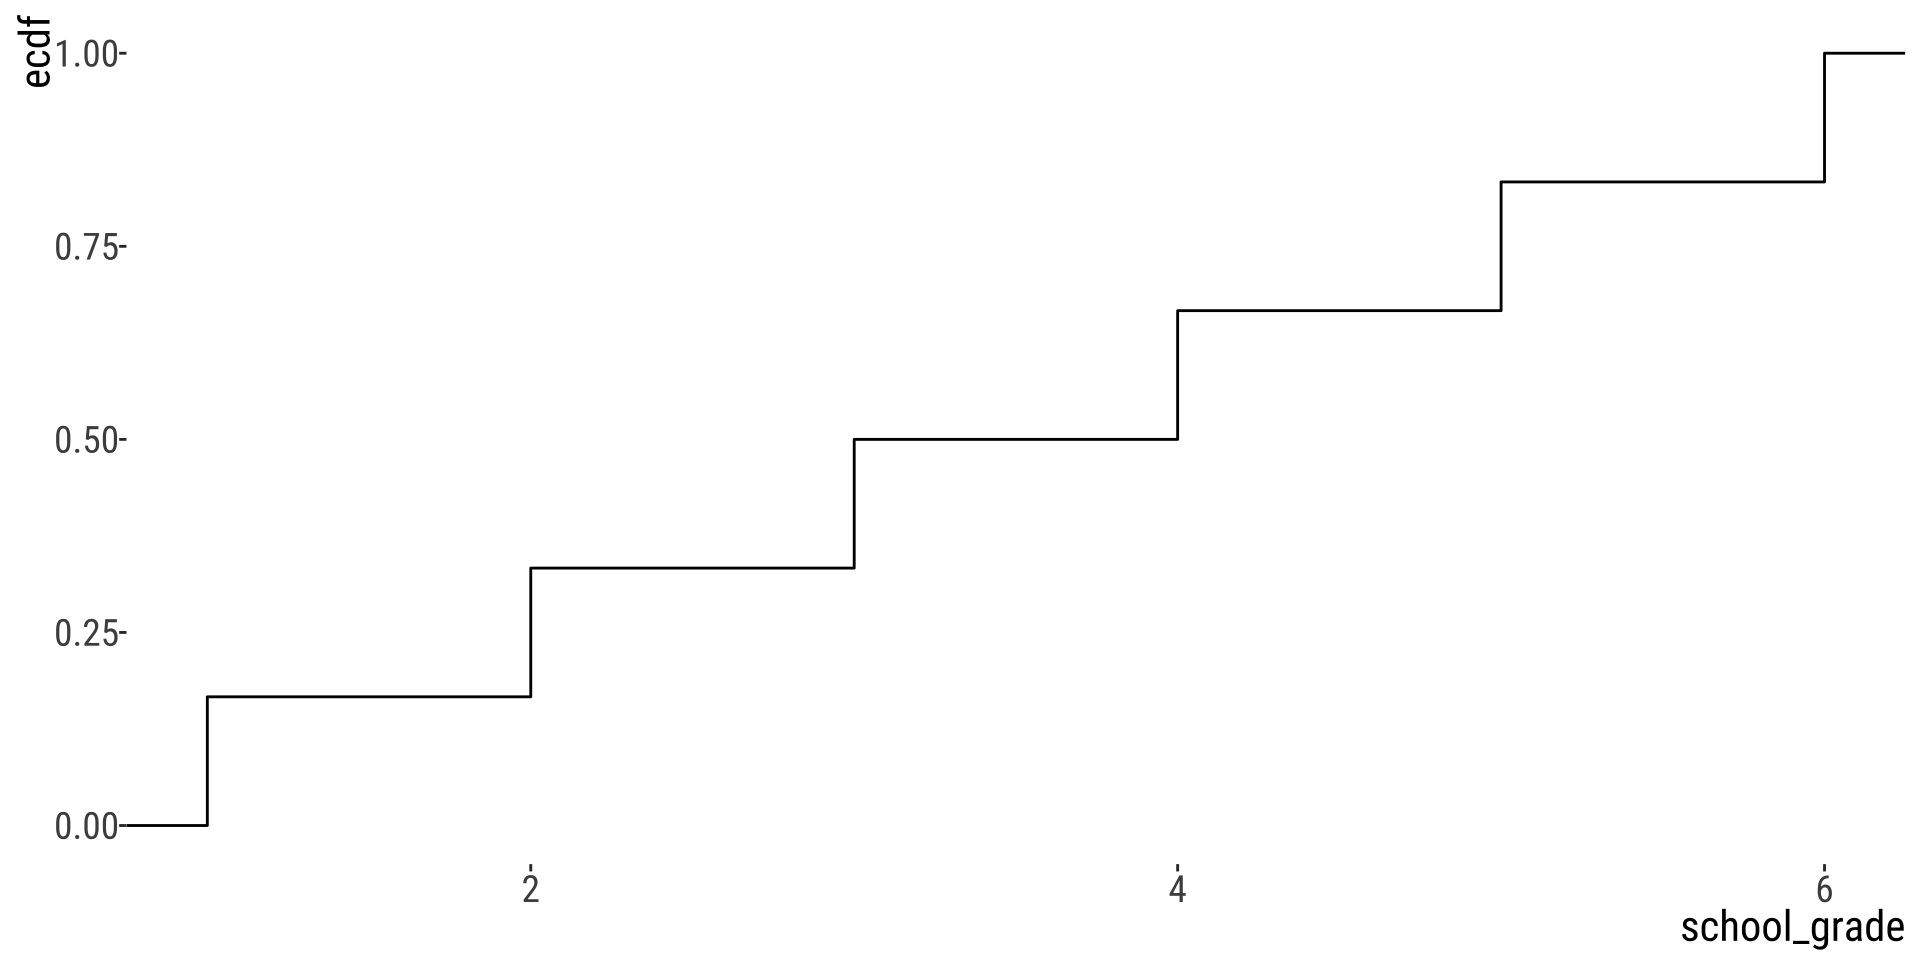
| school_grade | Frequency_of_Students |
|---|---|
| 1 | 23 |
| 2 | 20 |
| 3 | 15 |
| 4 | 12 |
| 5 | 10 |
| 6 | 8 |
2.5.Displaying & Describing Data
Plots and Tables
2025-09-29
Cumulative Frequency Distributions
- Plot the values on the \(x\) and their cumulative relative frequencies on the \(y\)
- Connect the values with lines
Cumulative Frequency Distributions
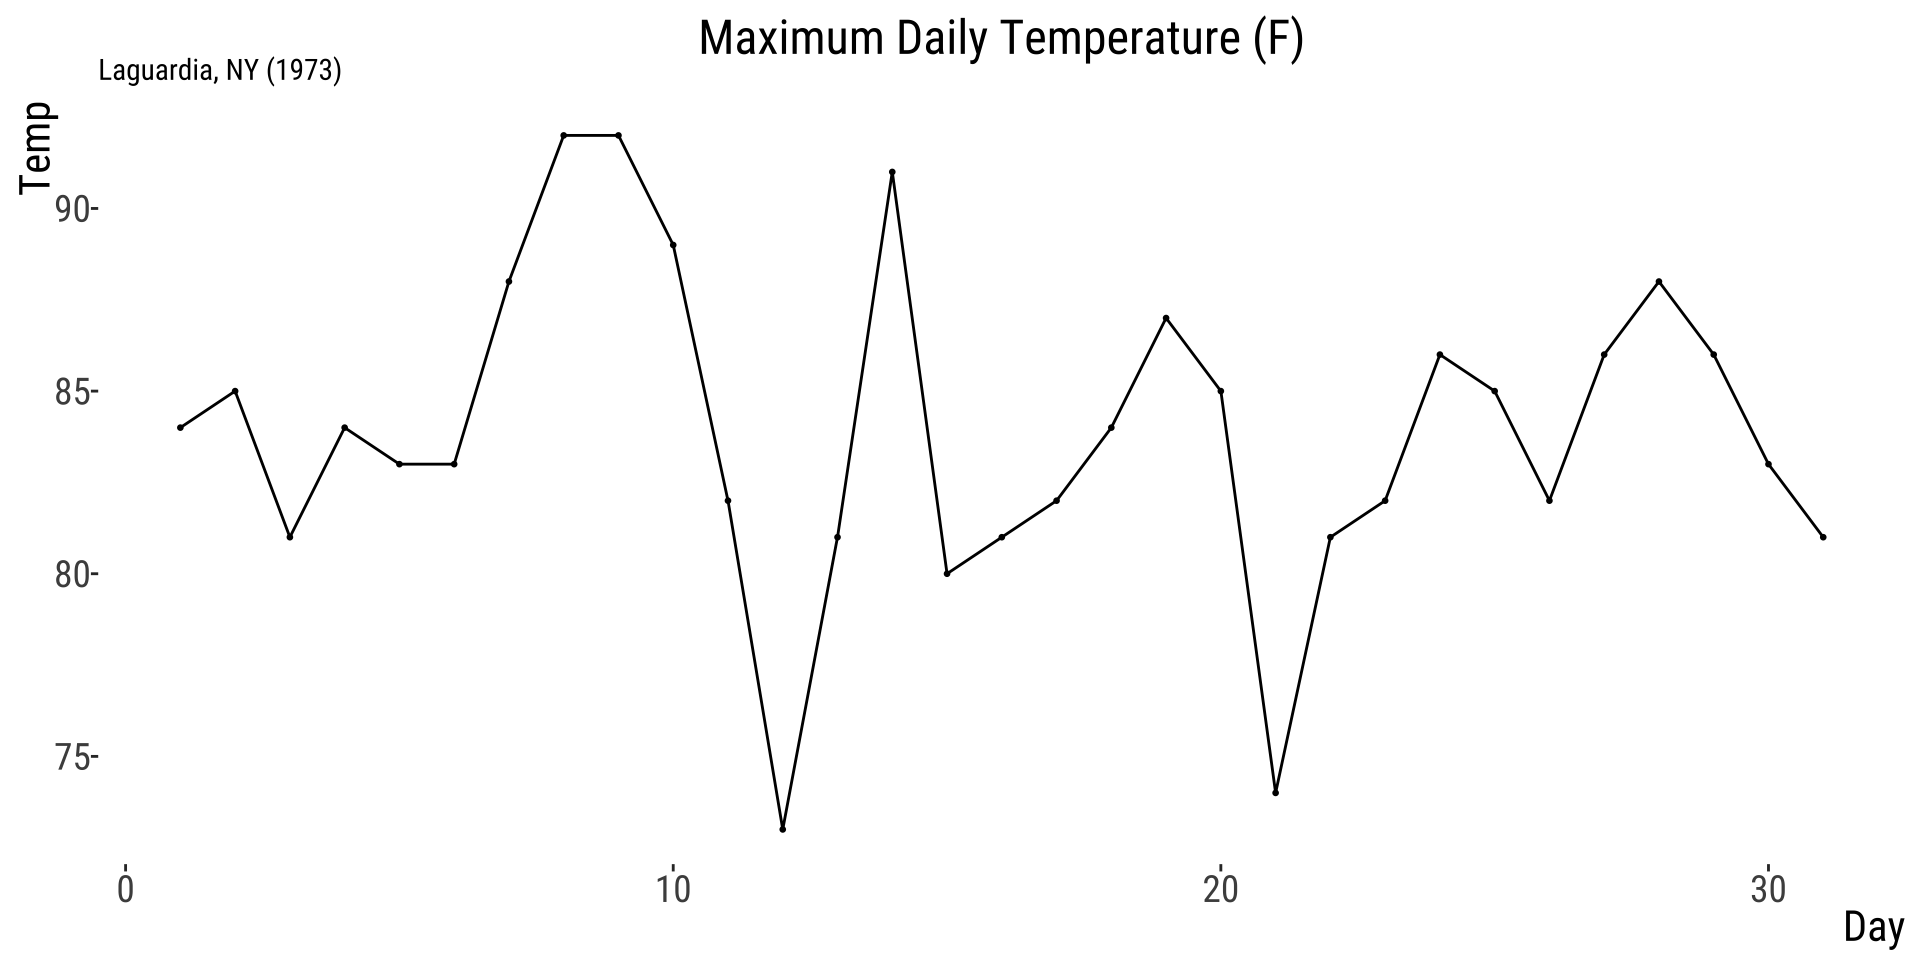
example 2: Temperatures near LaGuardia (1973)
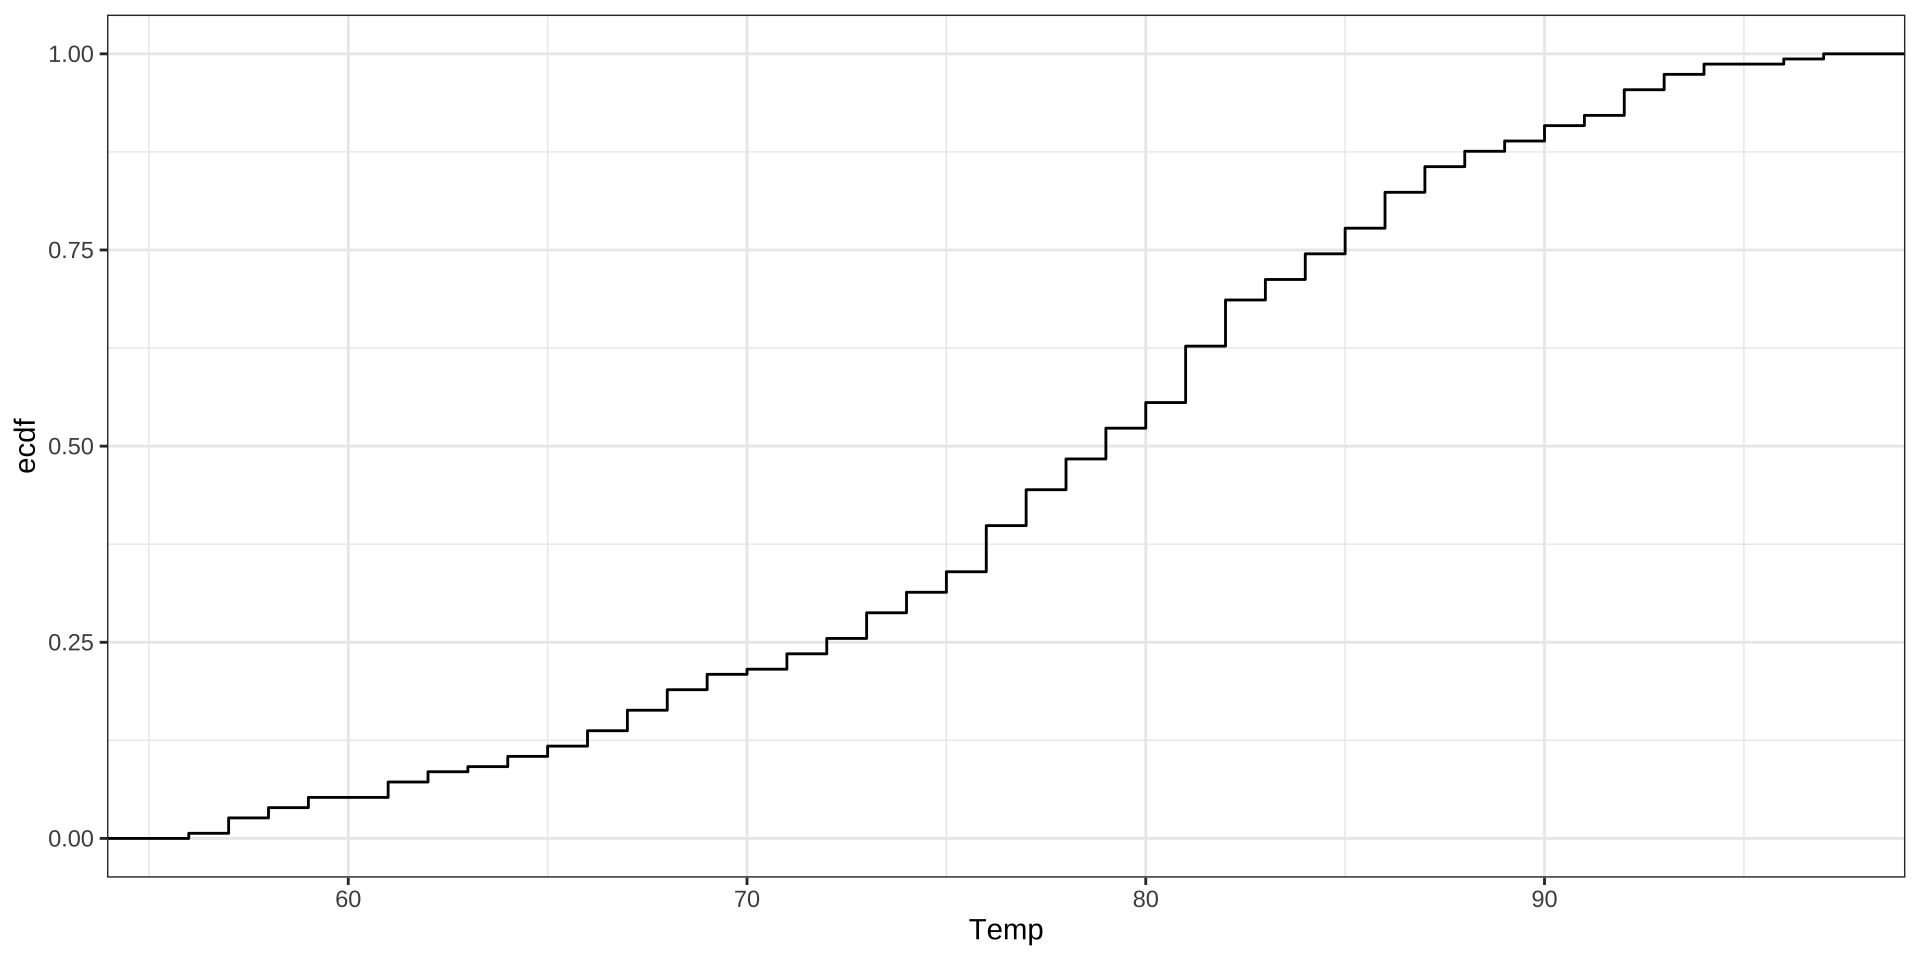
ECDF: empirical cumulative distribution function
Cumulative Frequency Distributions
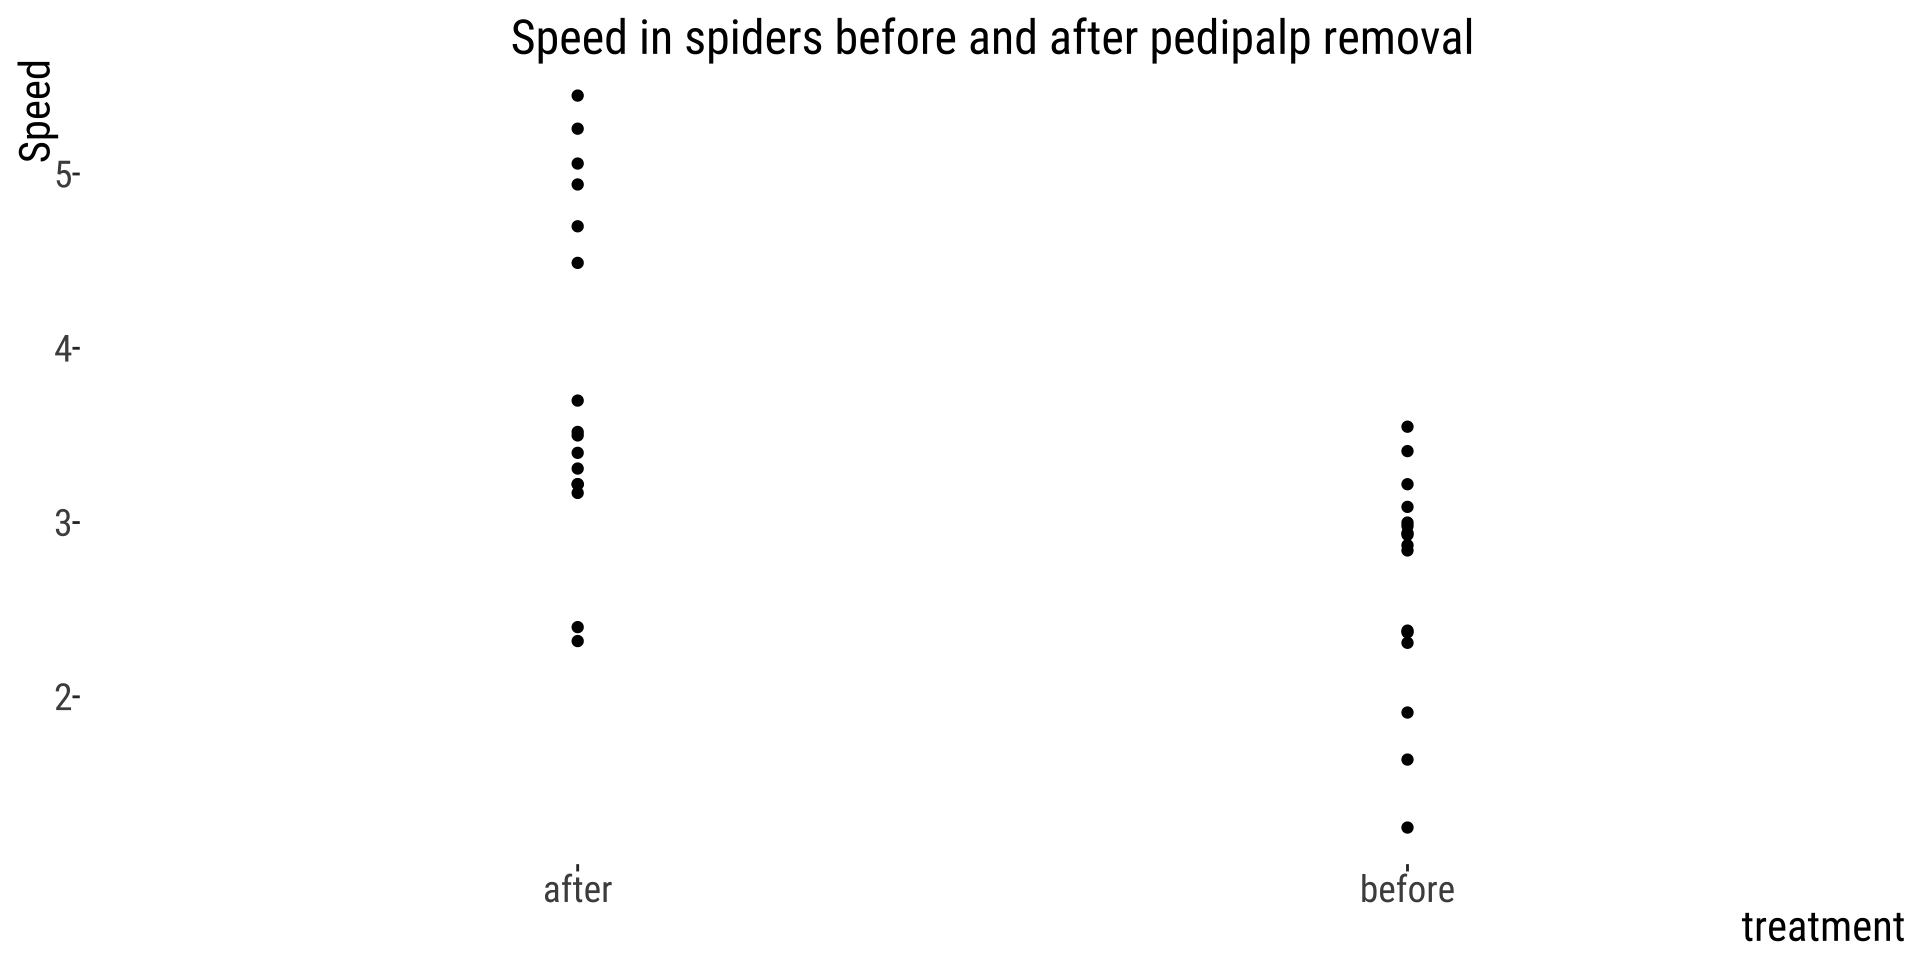
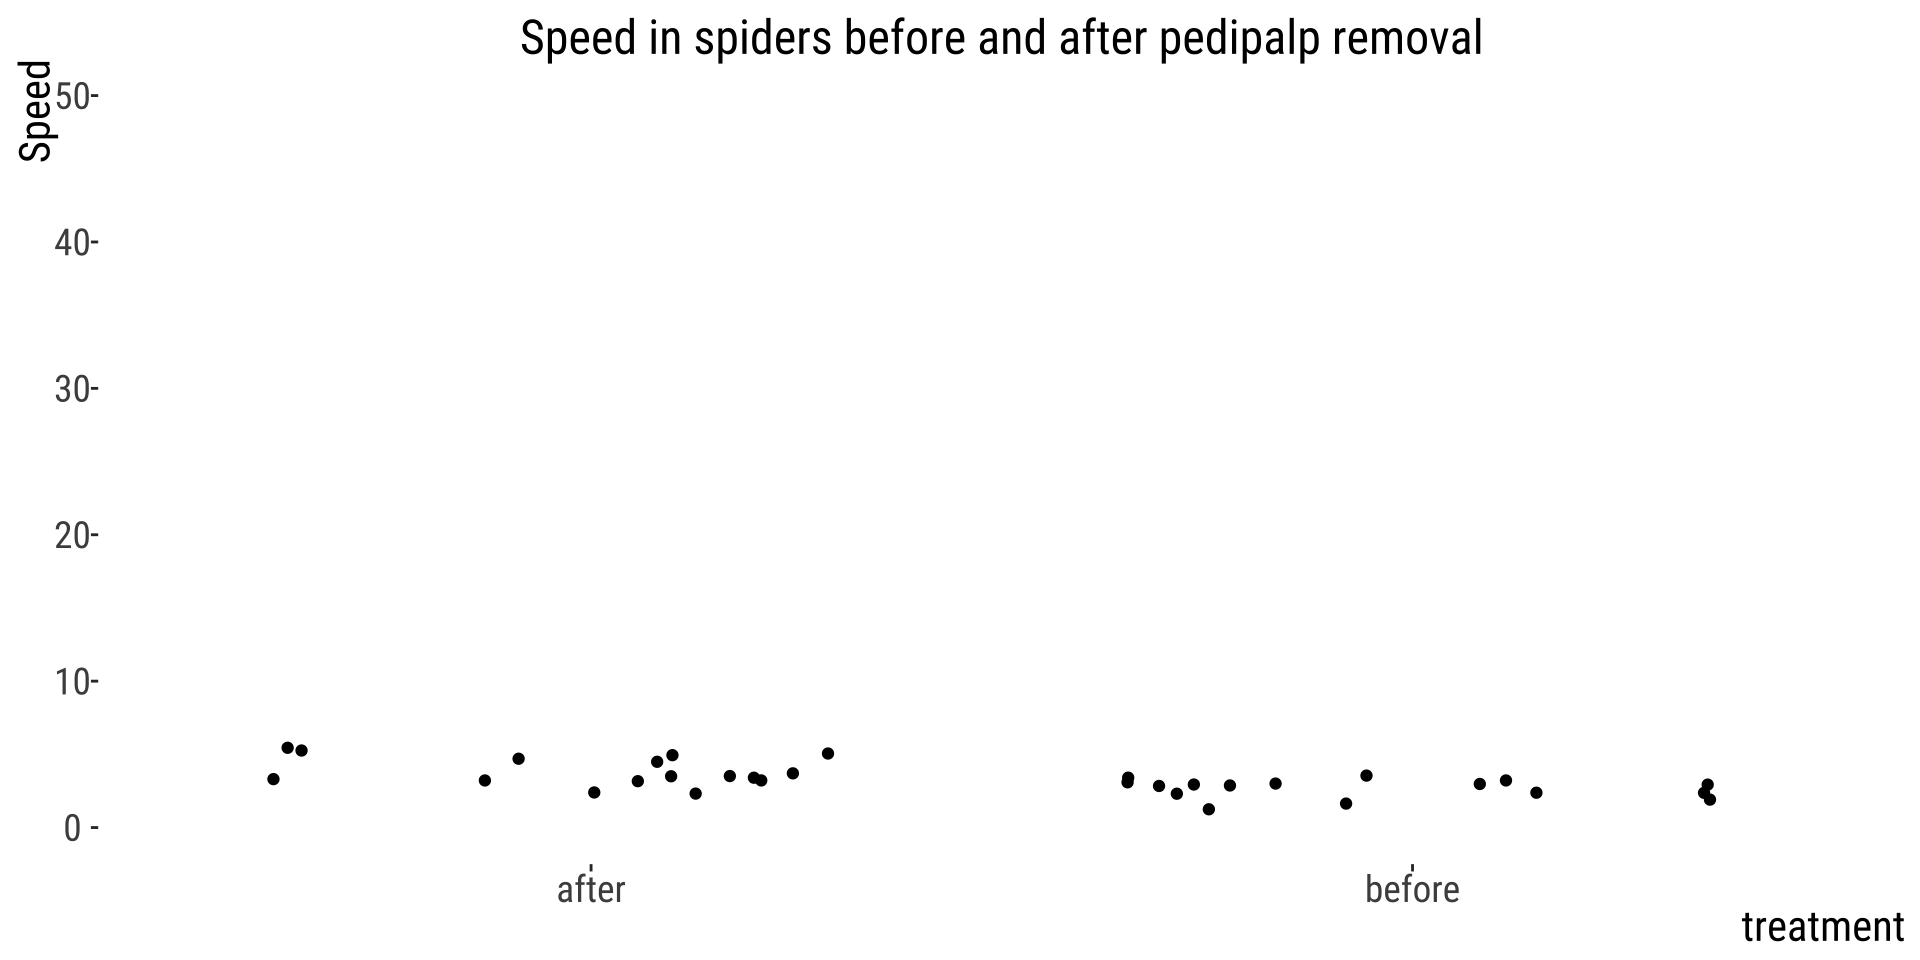
Example 3: Spider running speed
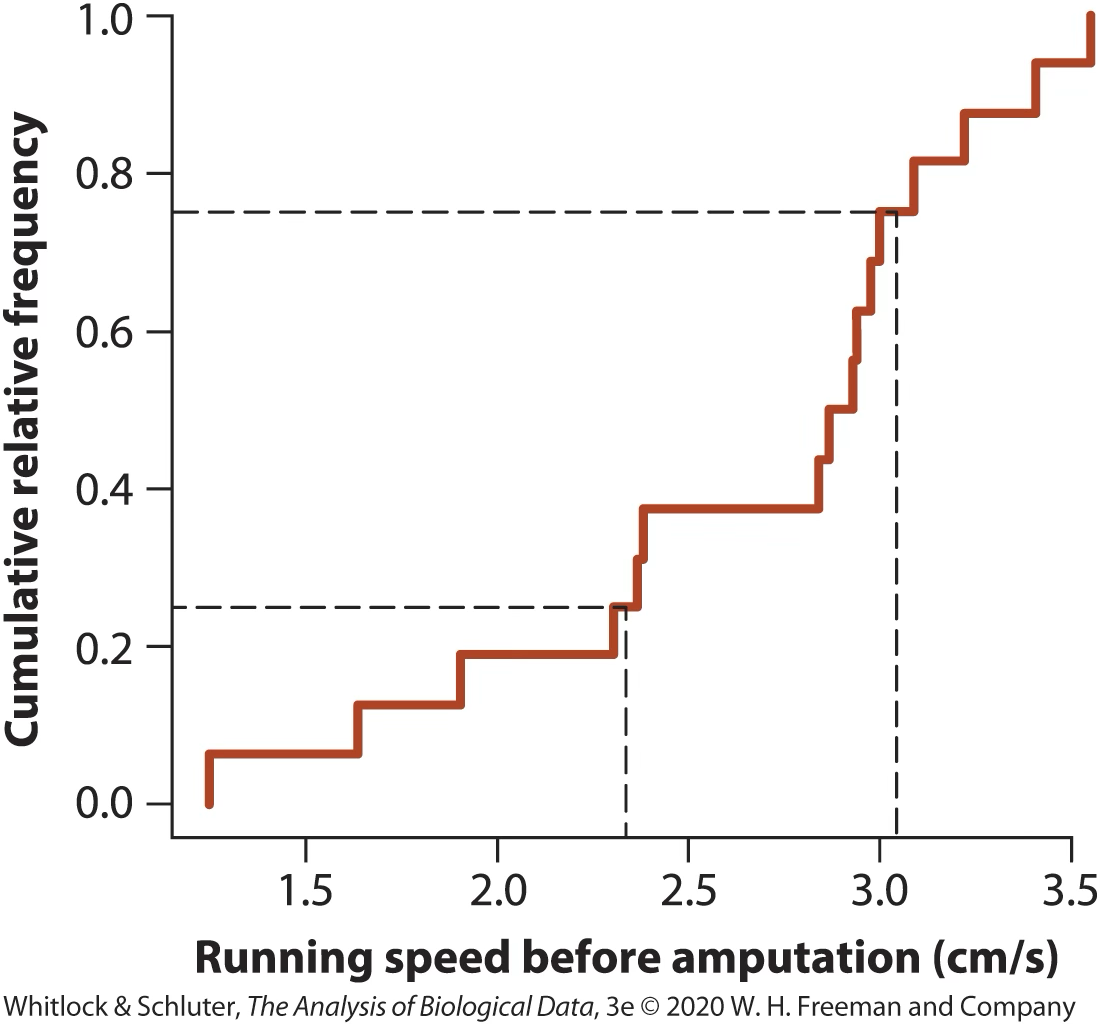
Figure caption: Figure 3.4-1 from the textbook
Cumulative frequency distributions clearly communicate quantiles.
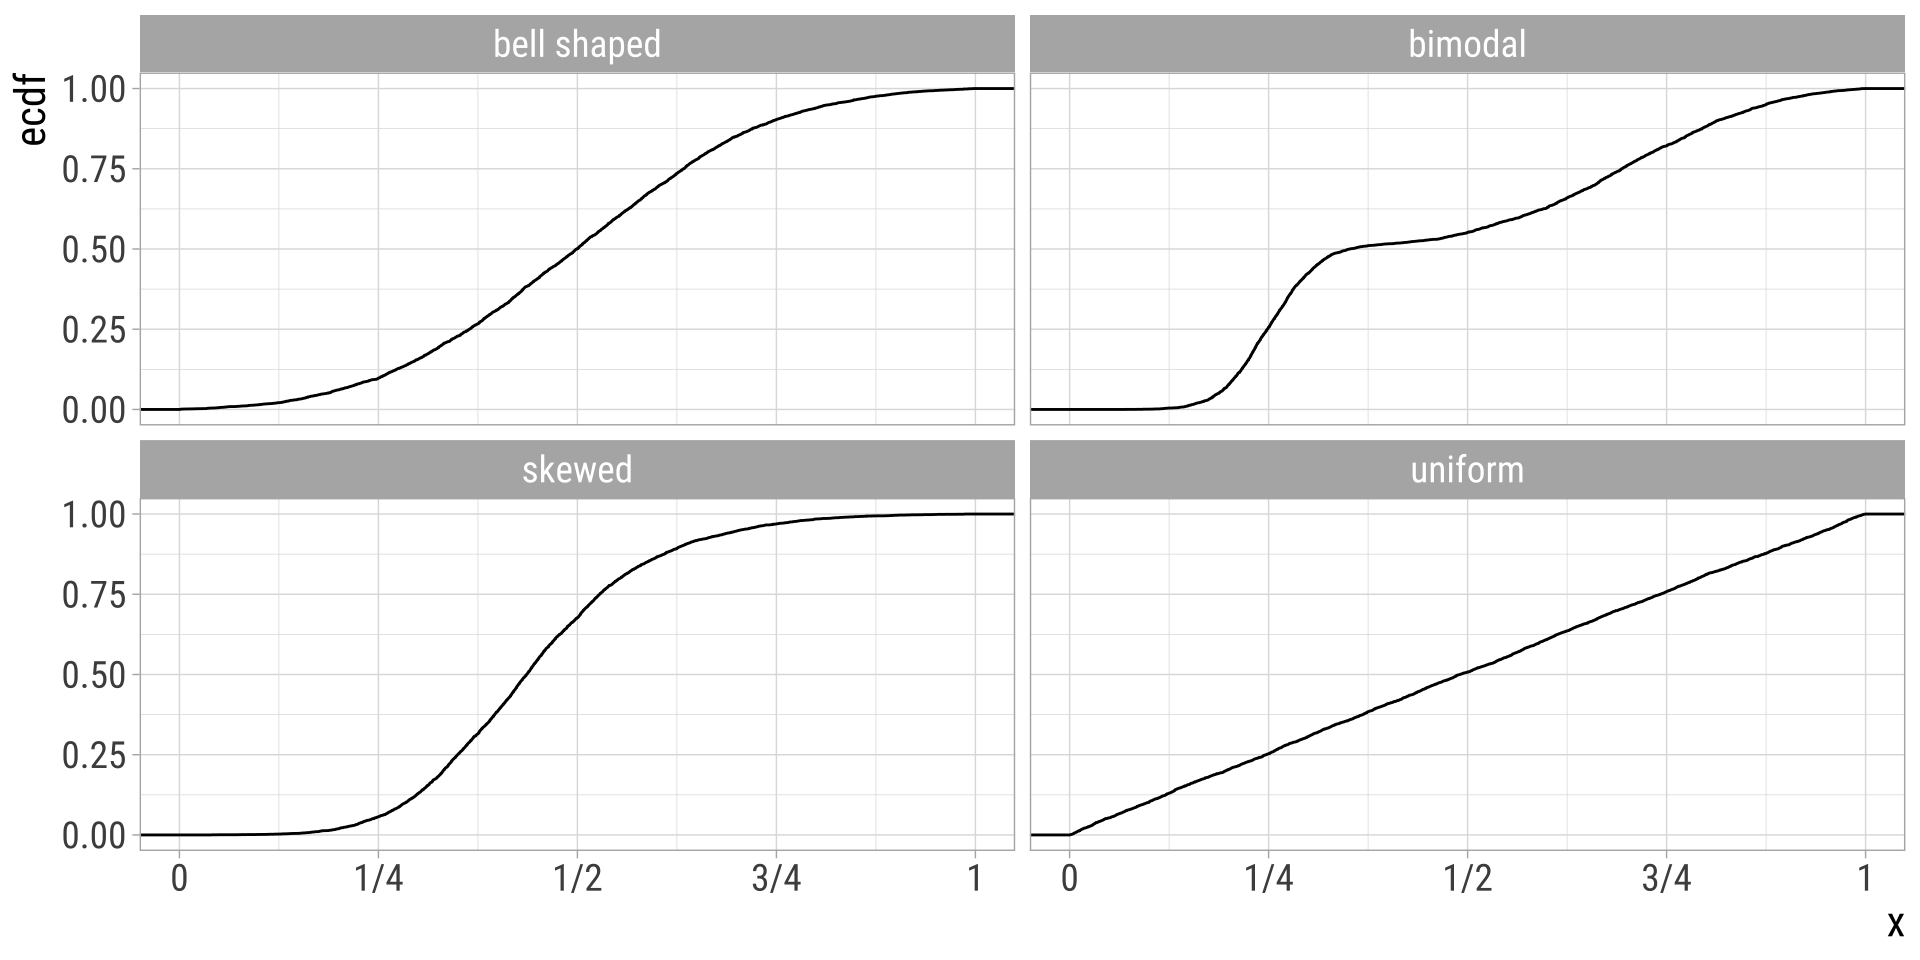
Distribution shapes
Histograms
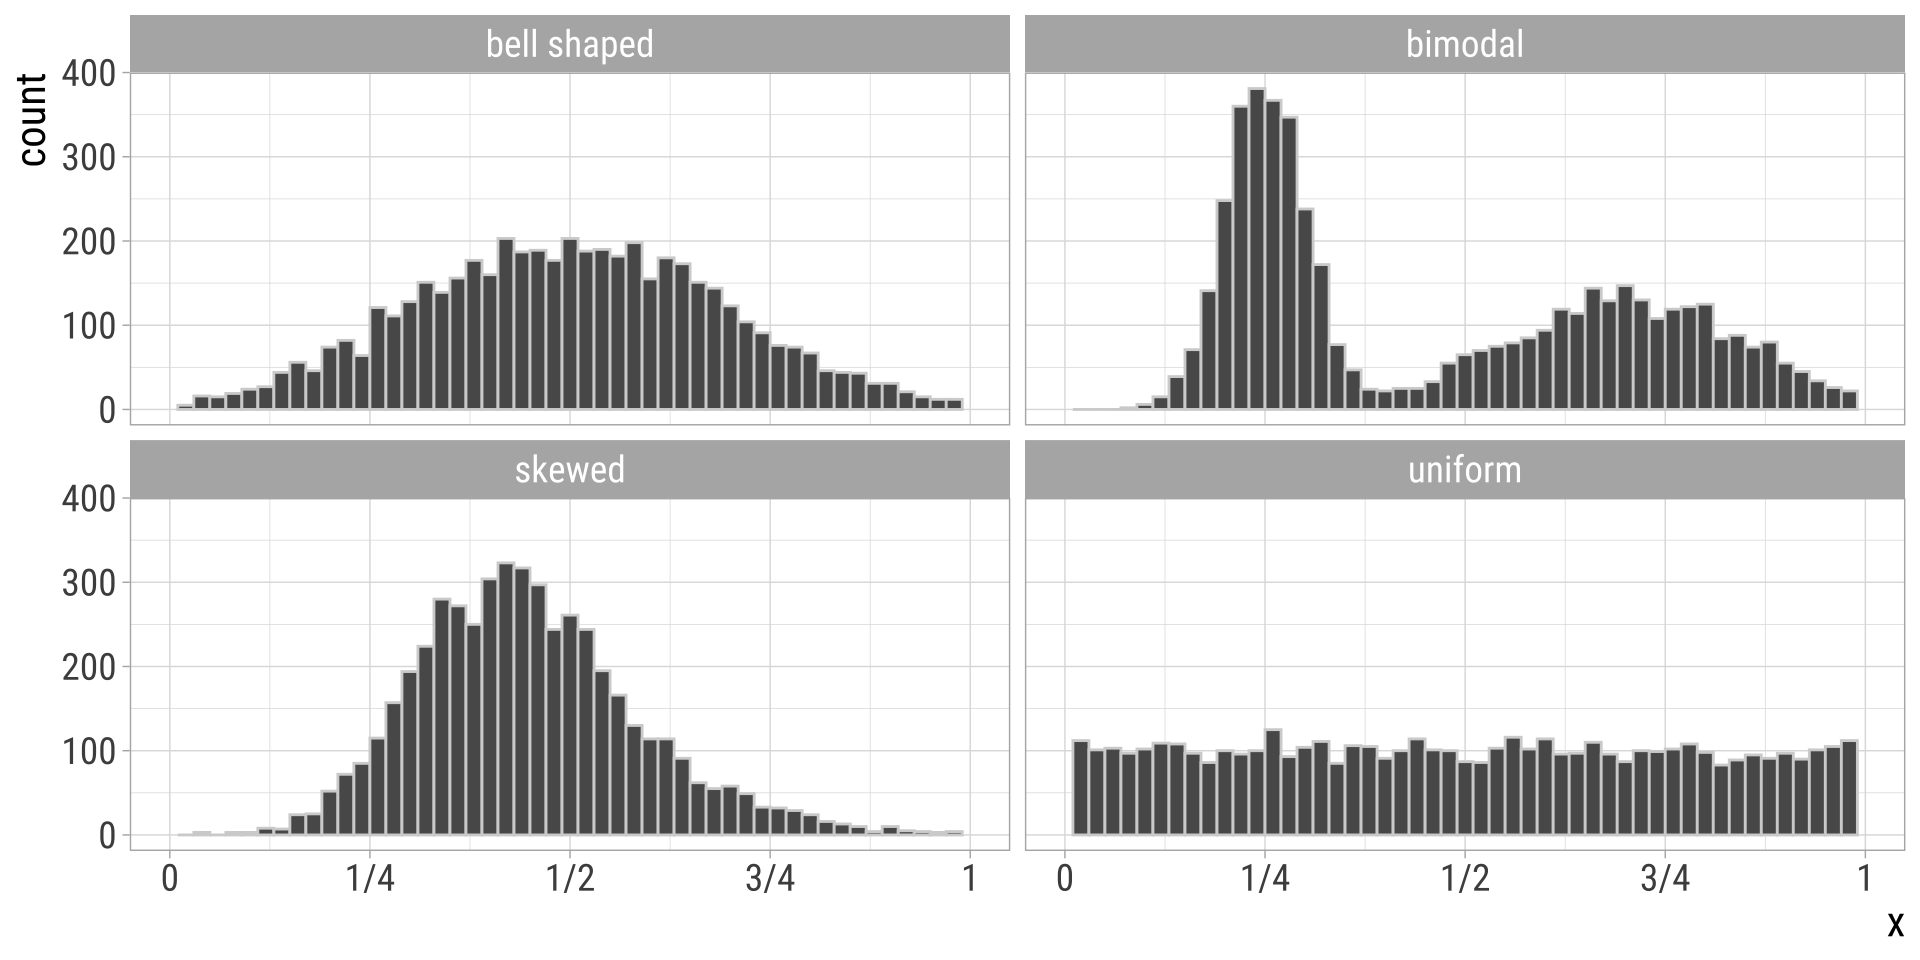
Distribution shapes
Cumulative Frequency Distributions
Categorical x Categorical
Contingency Table

From: Whitlock & Schluter, The Analysis of Biological Data
Categorical x Categorical
Grouped bar plot
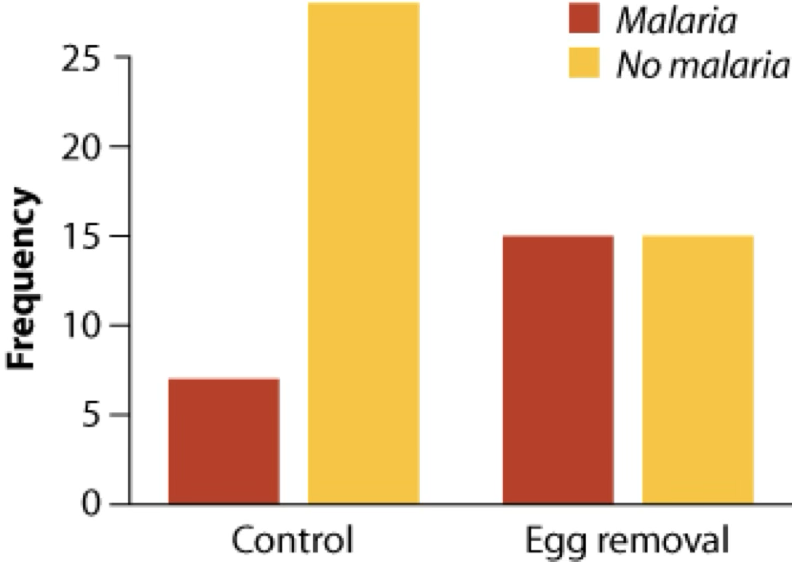
Figure caption: figure 2.3-1 from Whitlock & Schluter, The Analysis of Biological Data
Categorical x Categorical
Mosaic plot
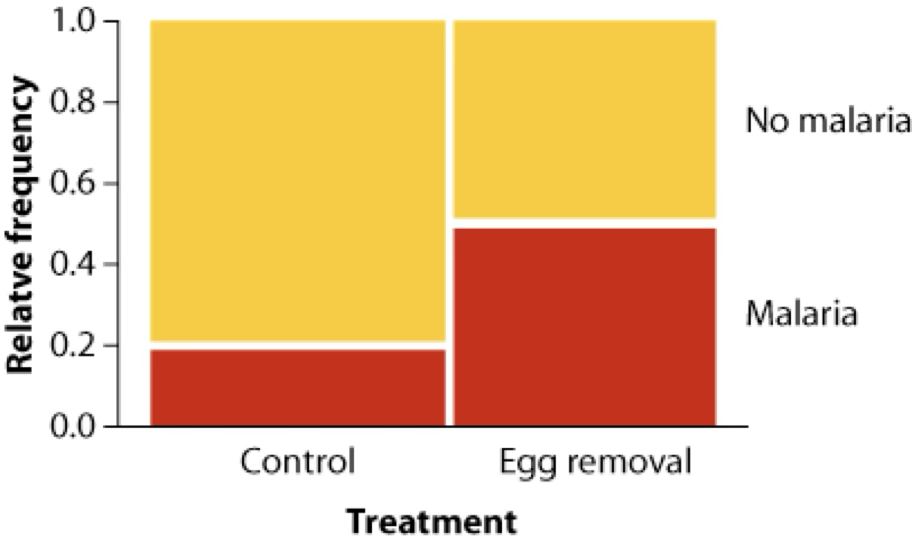
Figure caption: figure 2.3-2 from Whitlock & Schluter, The Analysis of Biological Data
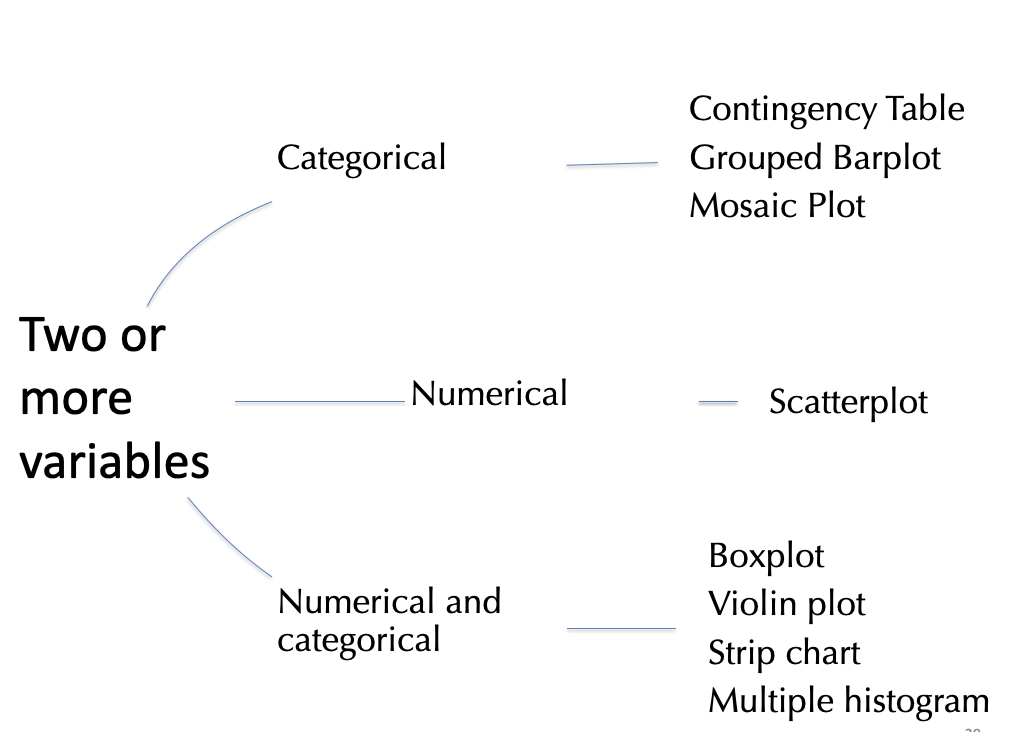
2+ variables. No upper limit, but too many variables may be confusing
Width indicates the relative proportion of the corresponding value
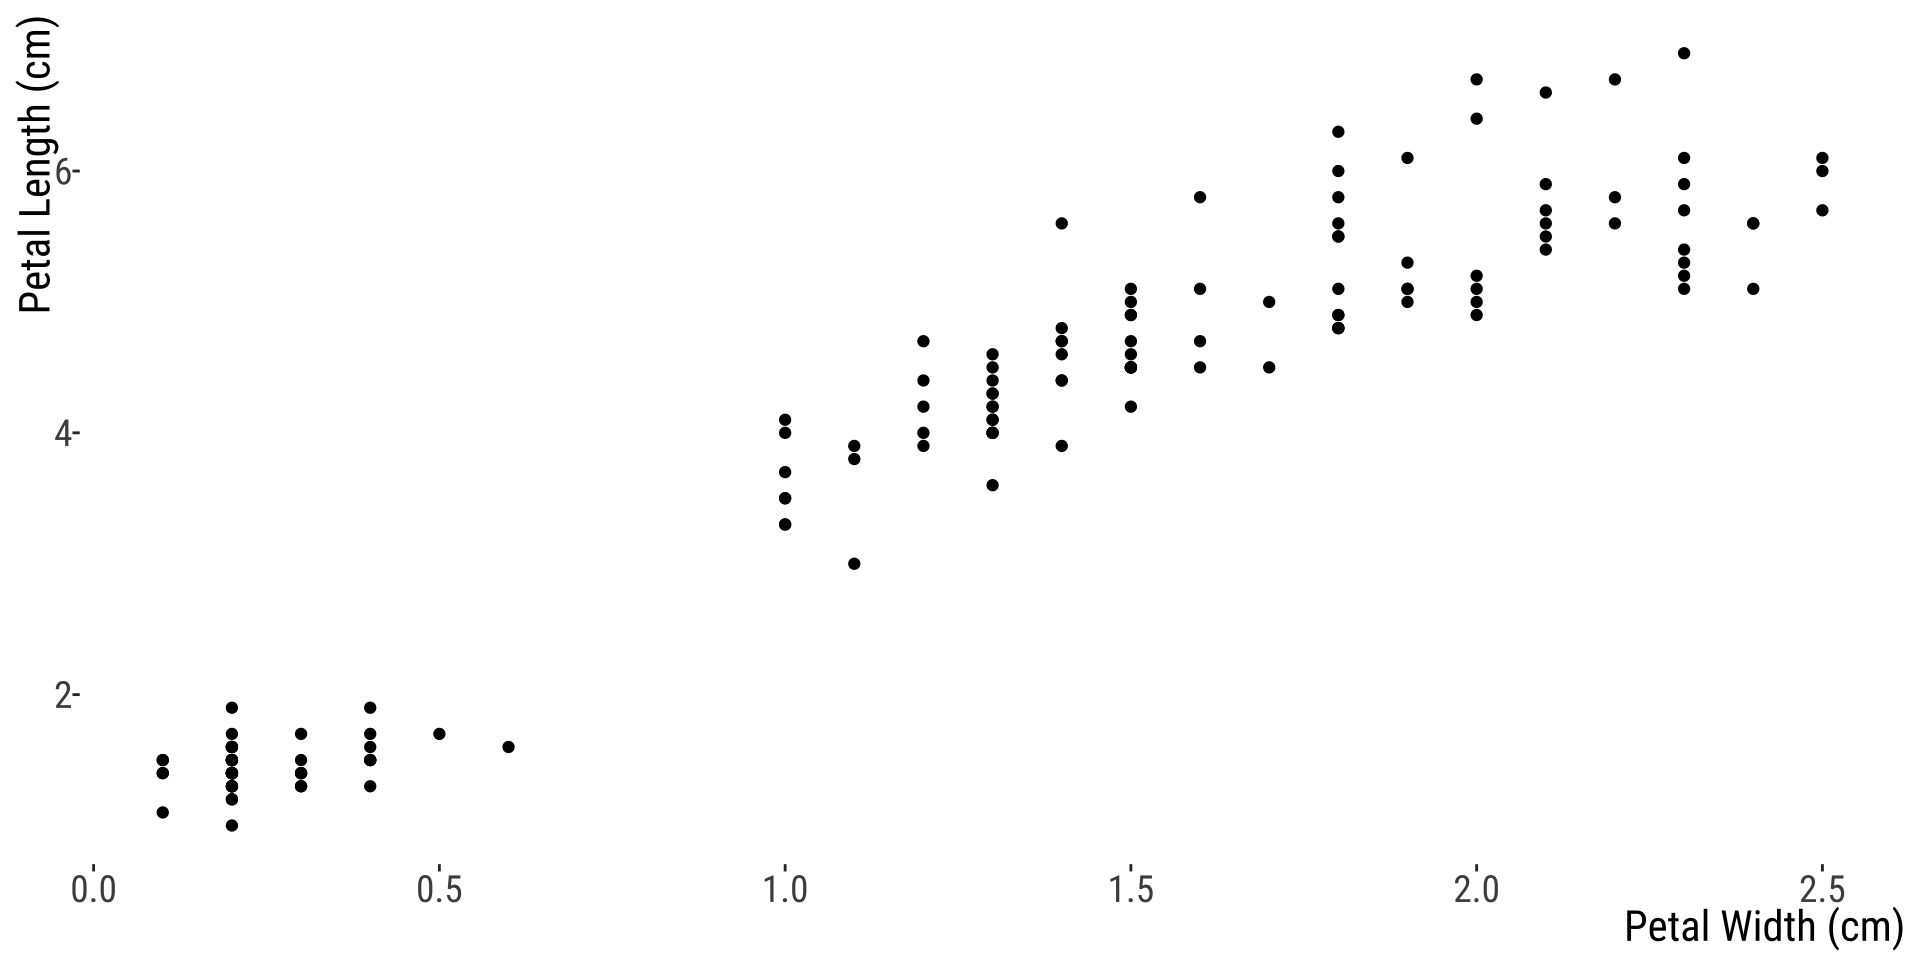
Numerical x Numerical
Scatter Plot
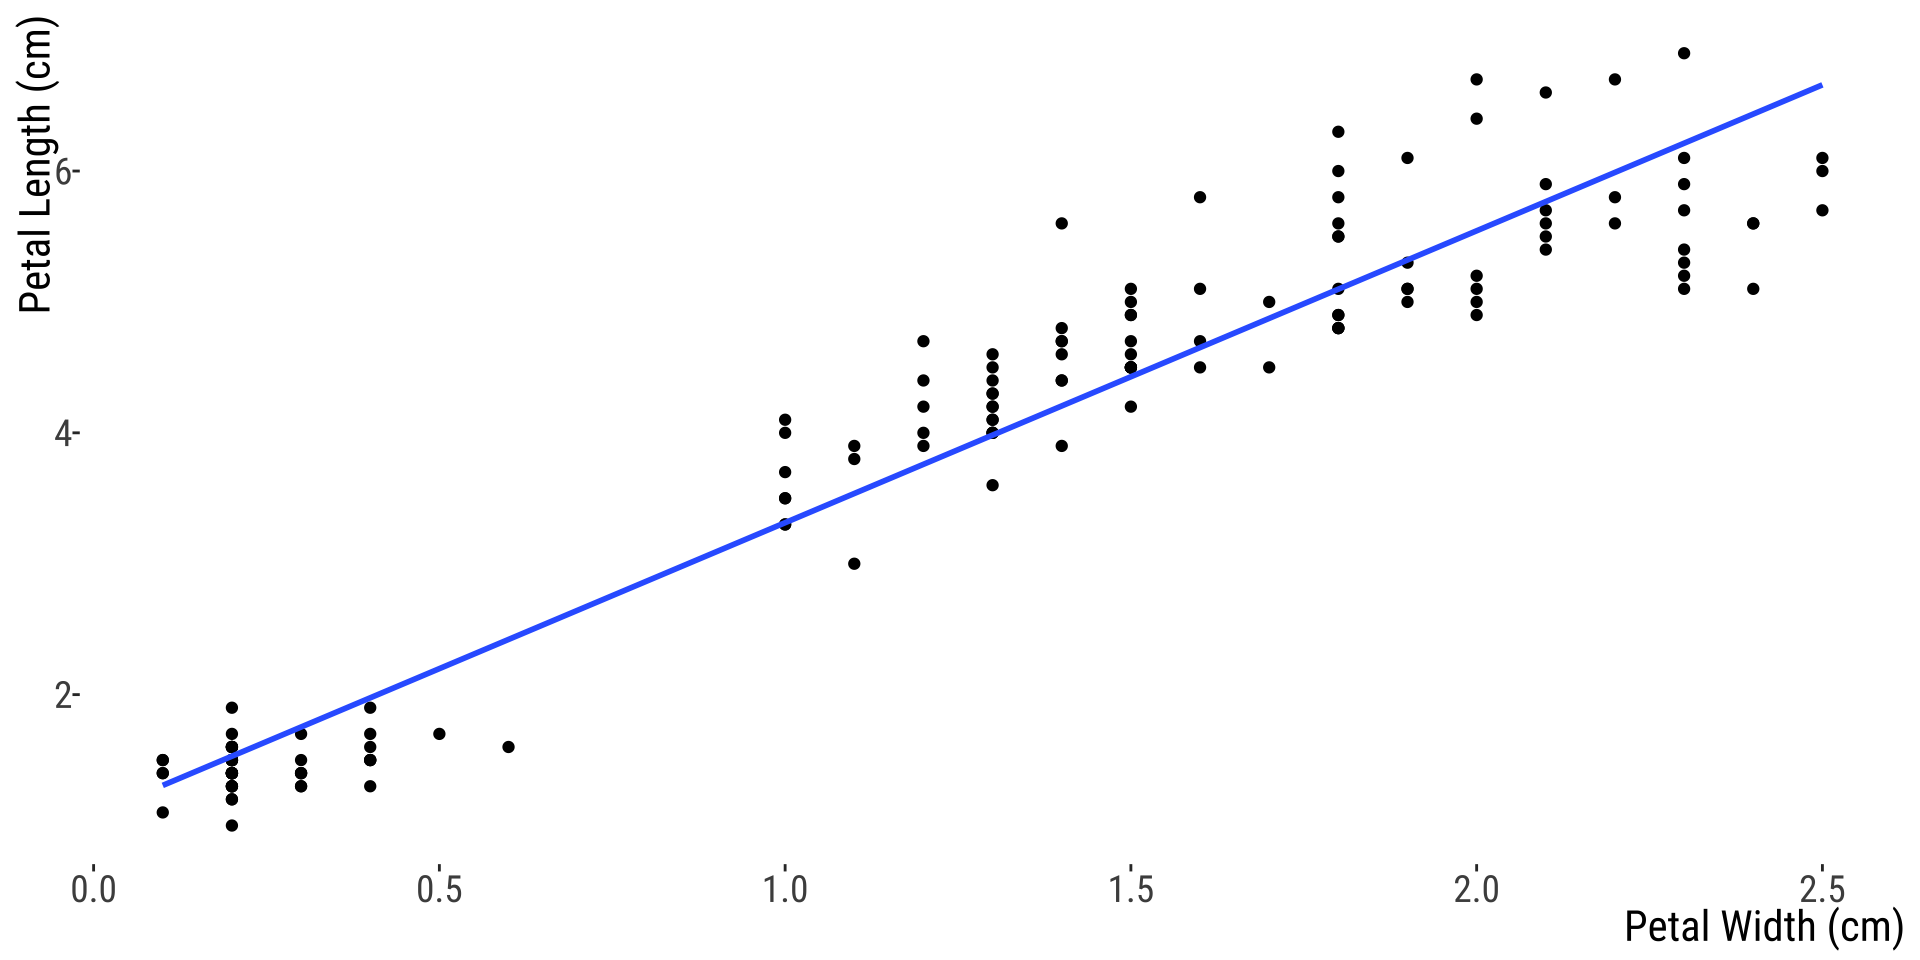
Numerical x Numerical
Scatter Plot
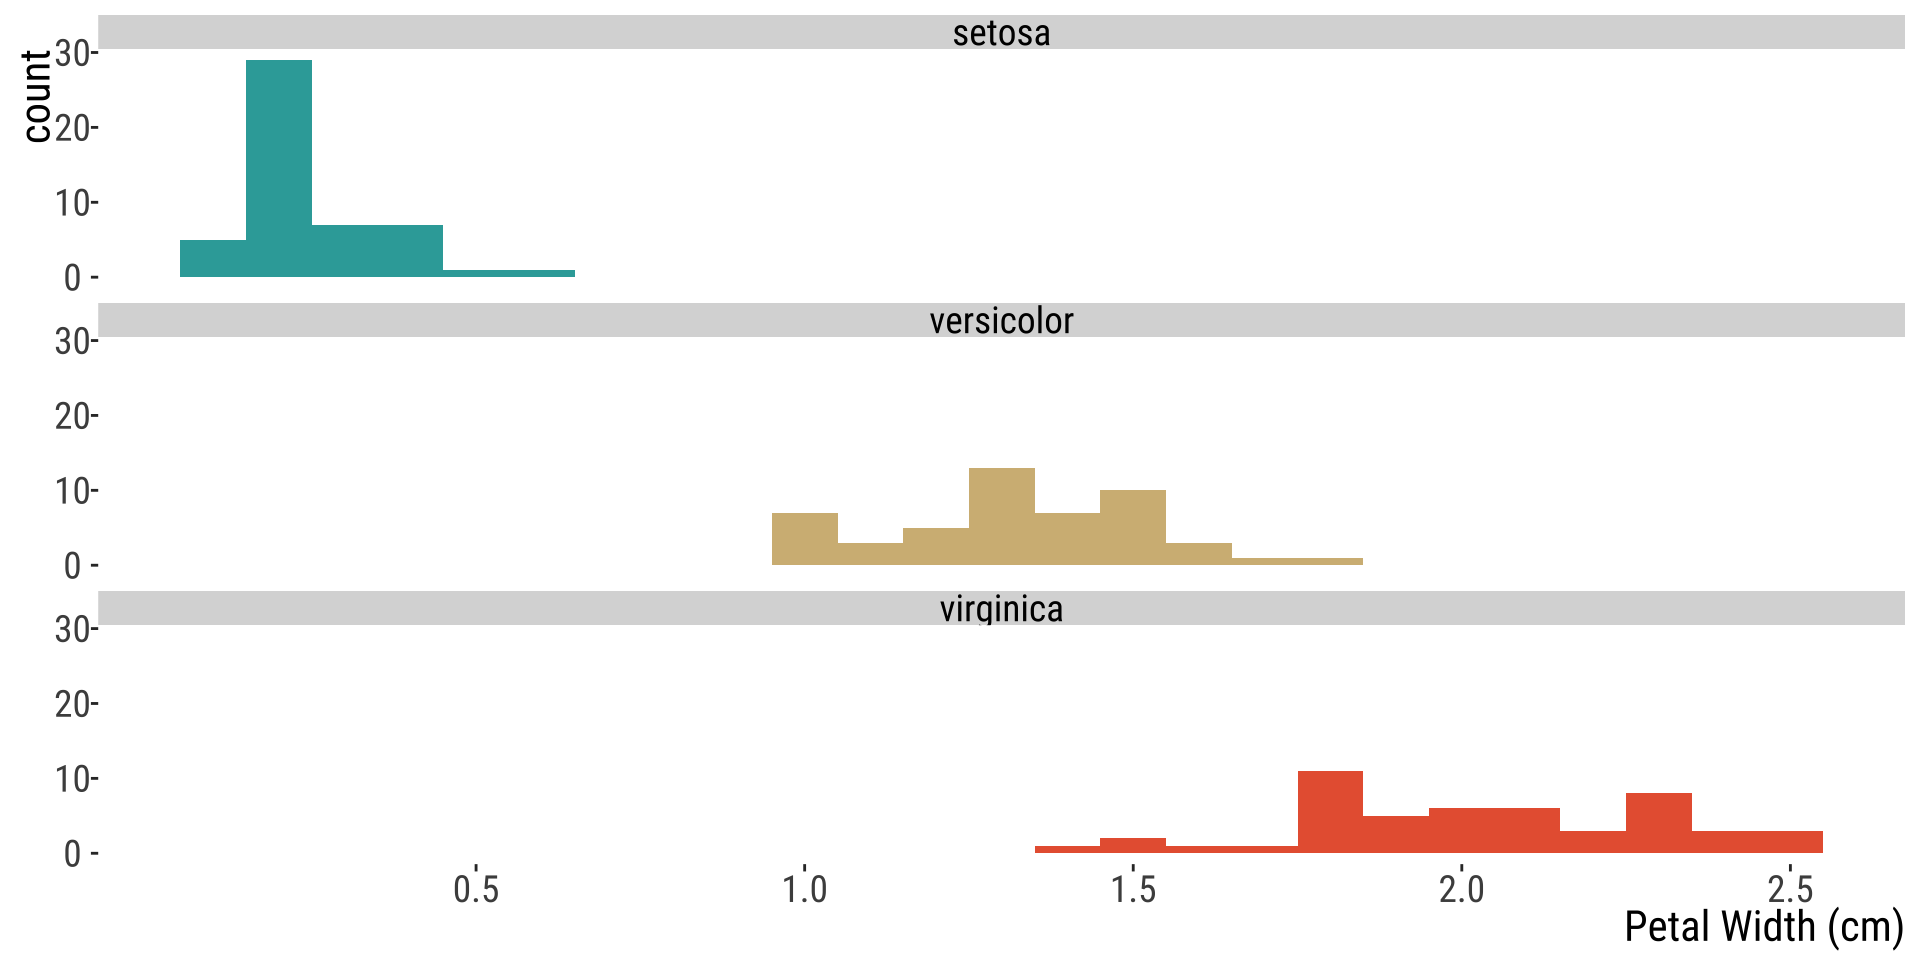
Numerical x Categorical
Multiple Histograms
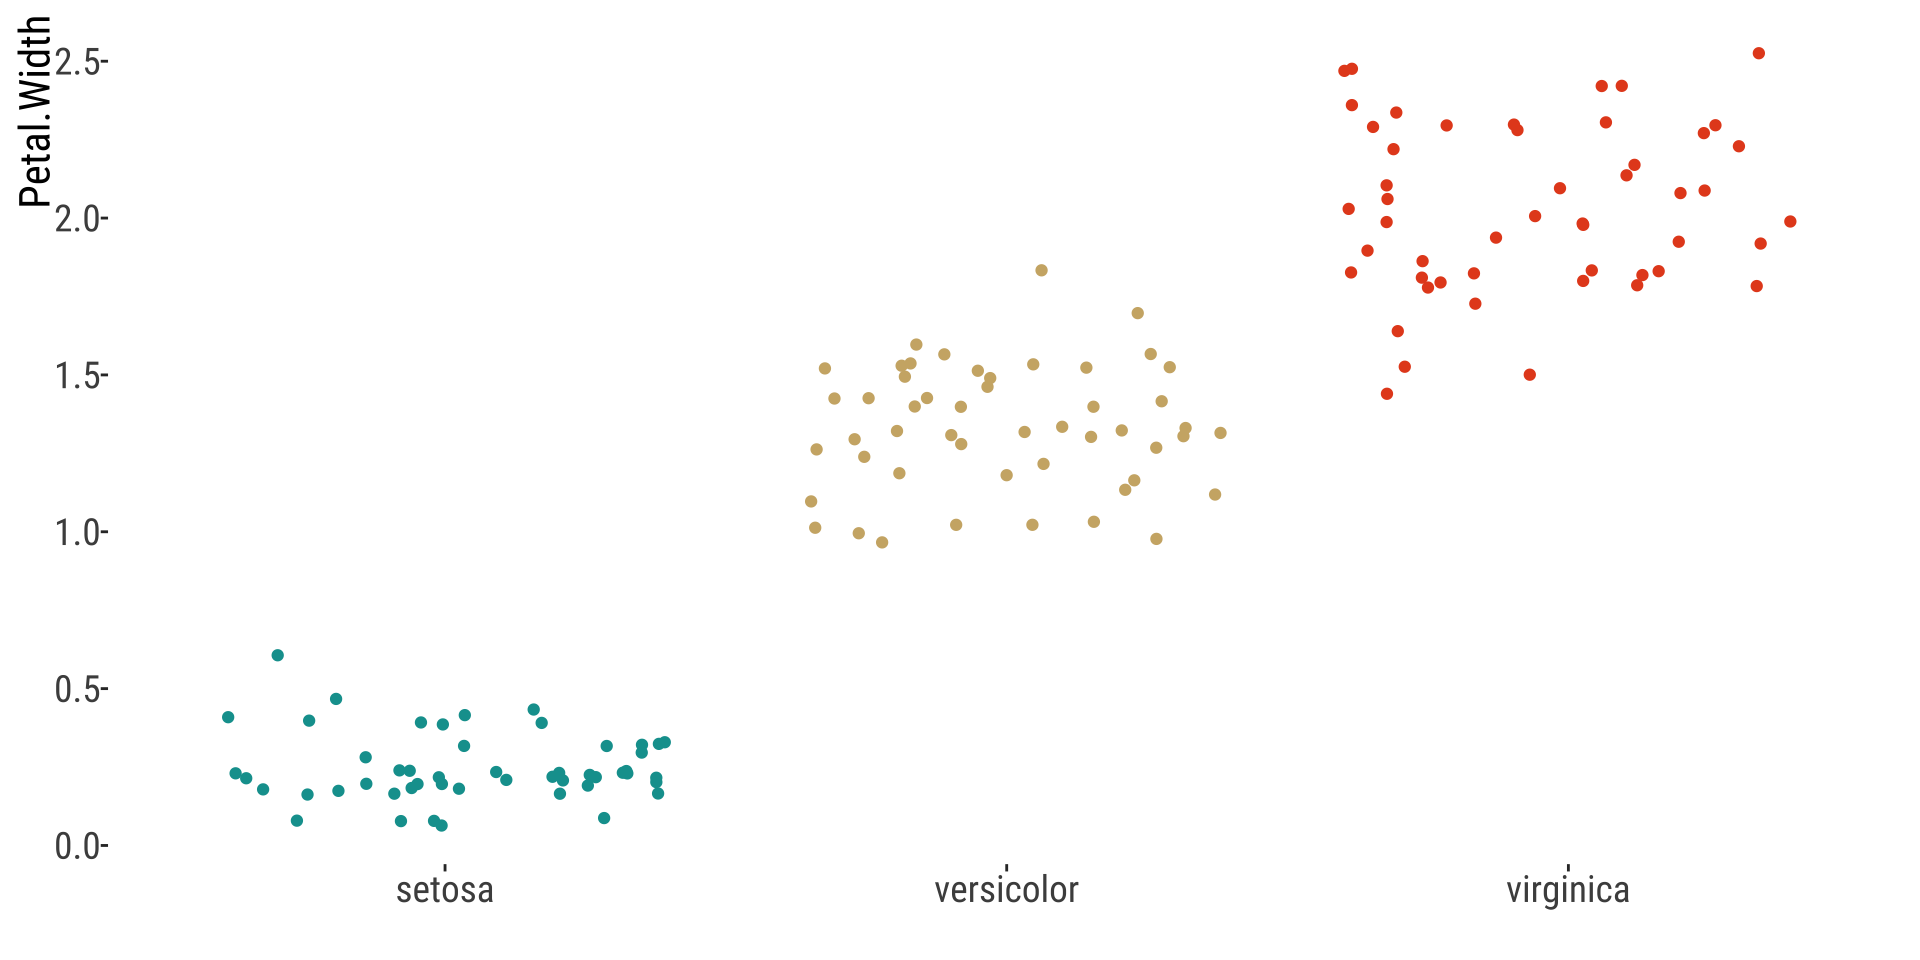
Numerical x Categorical
Strip Chart
Numerical x Categorical
Boxplot
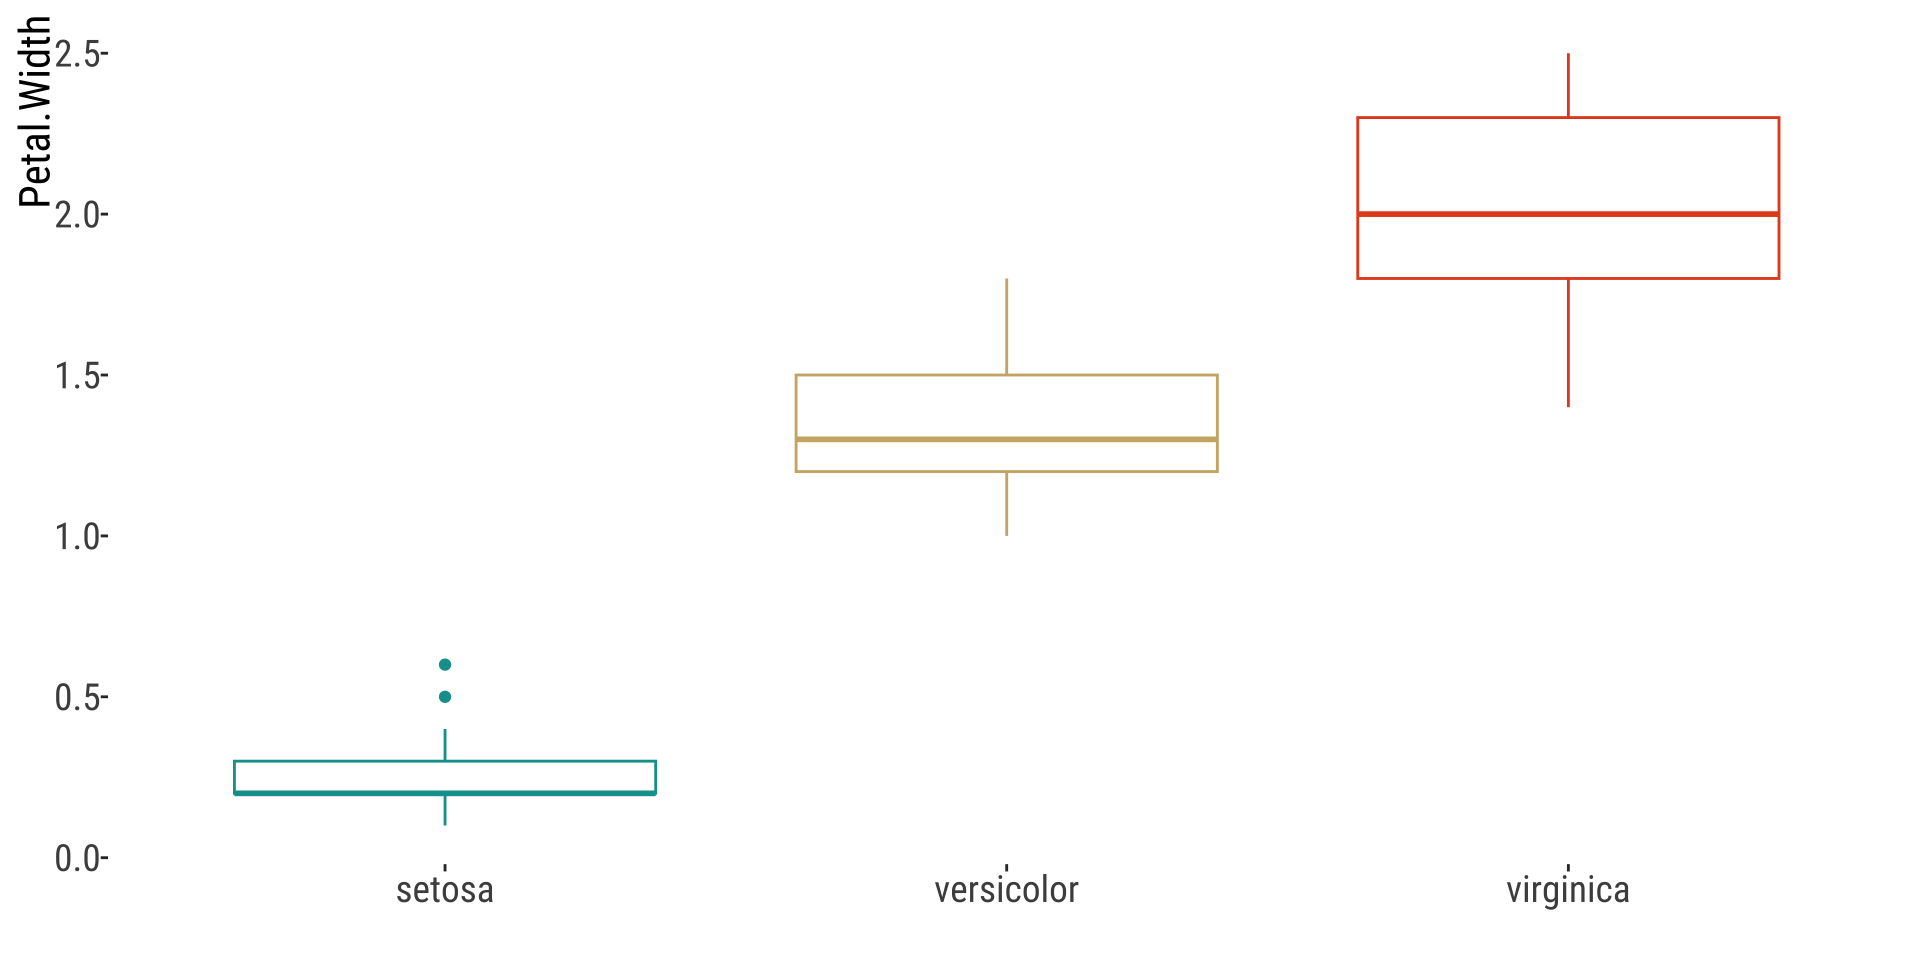
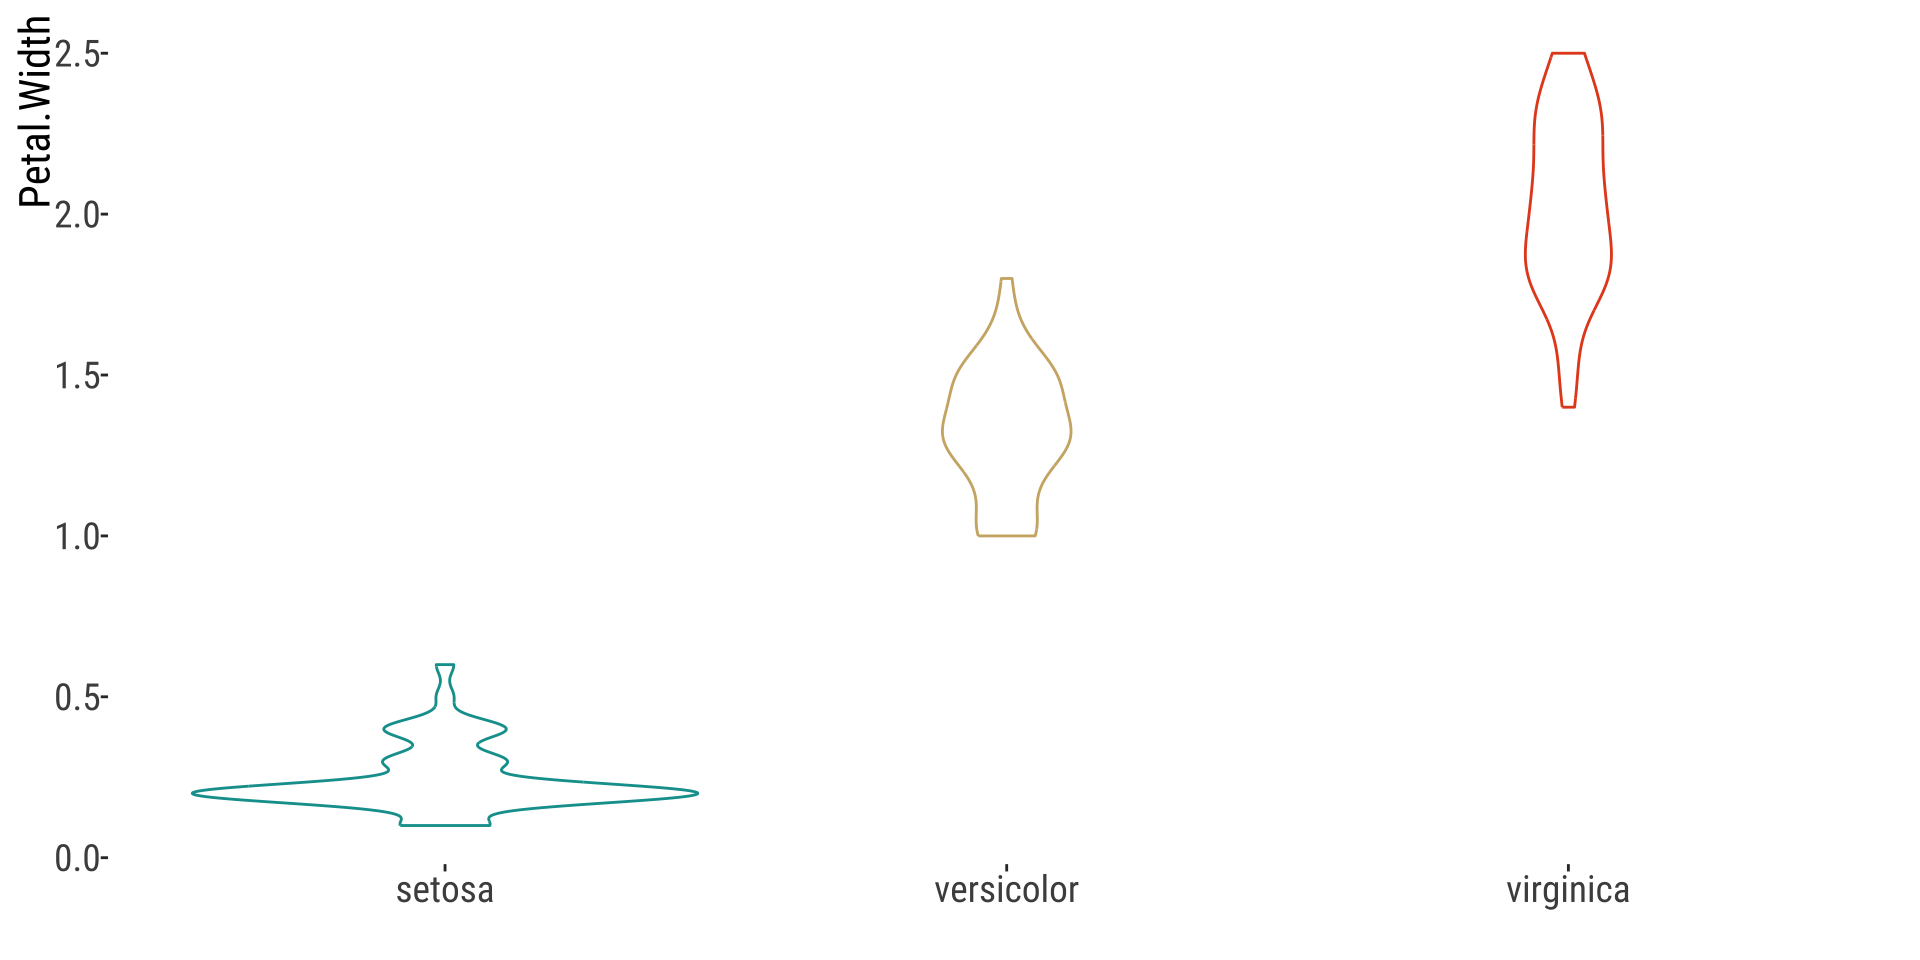
Numerical x Categorical
Violin Plot
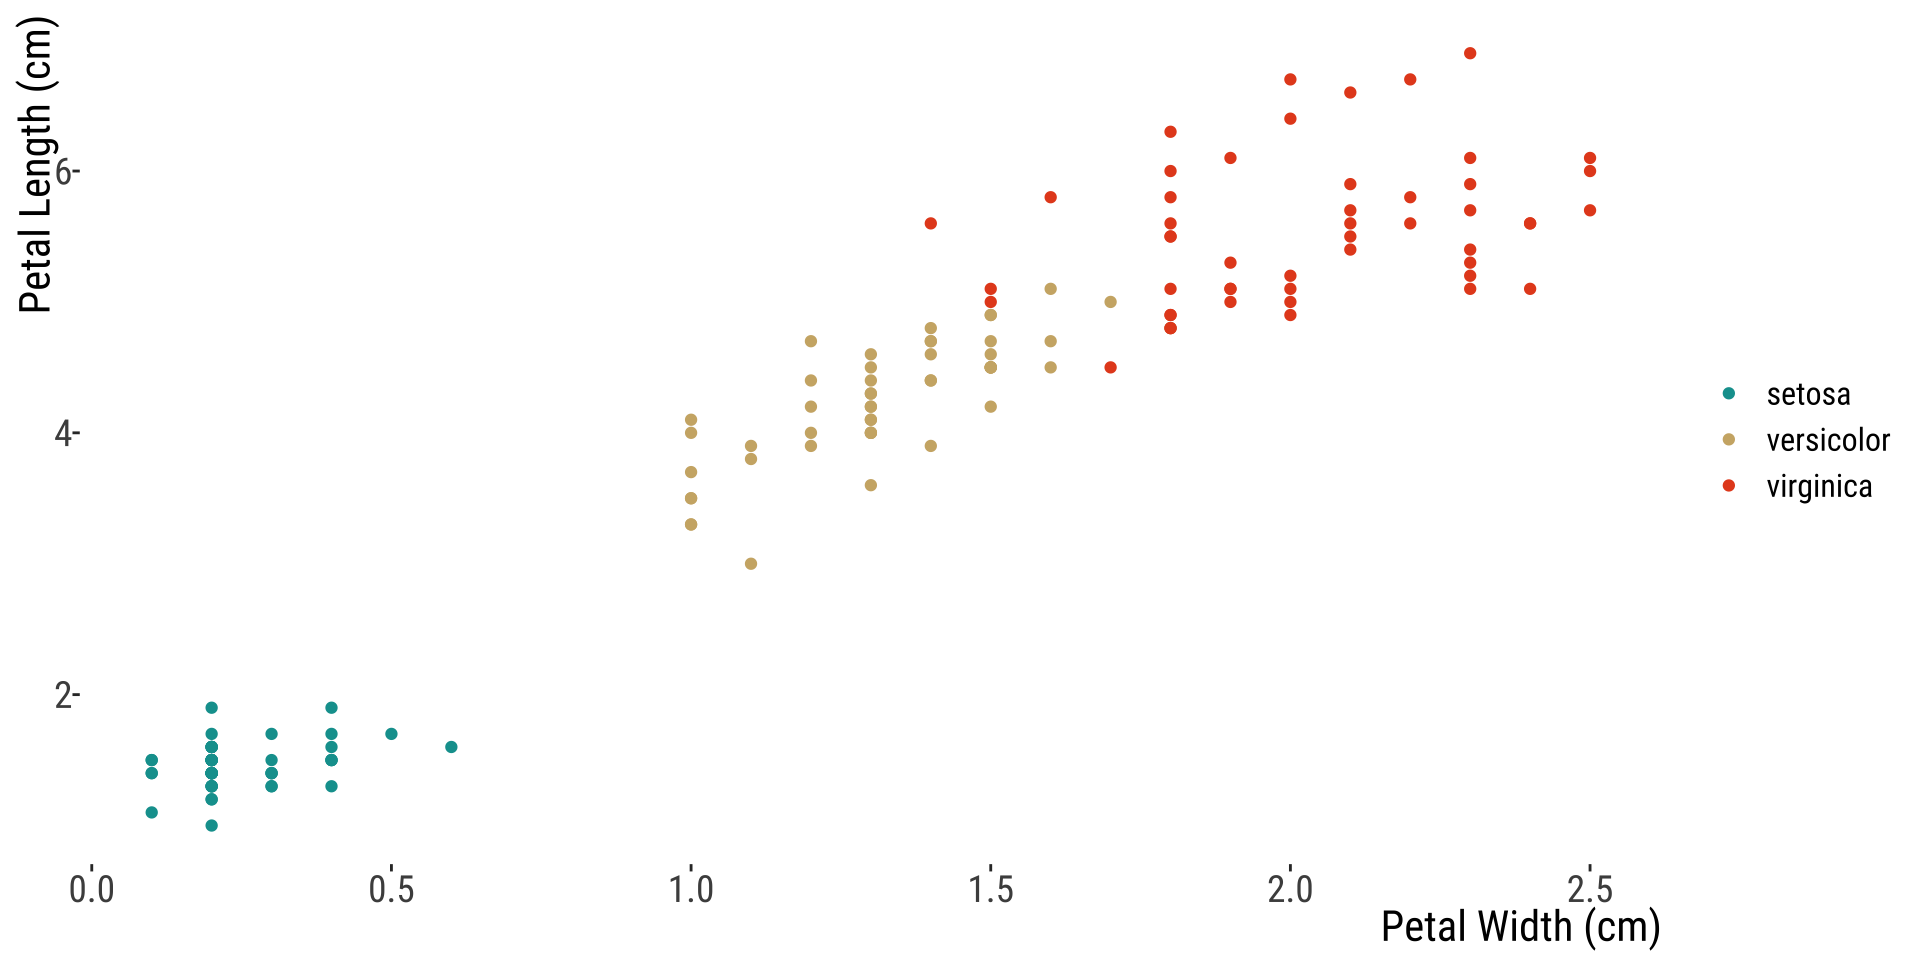
Numerical (2) + Categorical
Multiple Scatterplots with legend
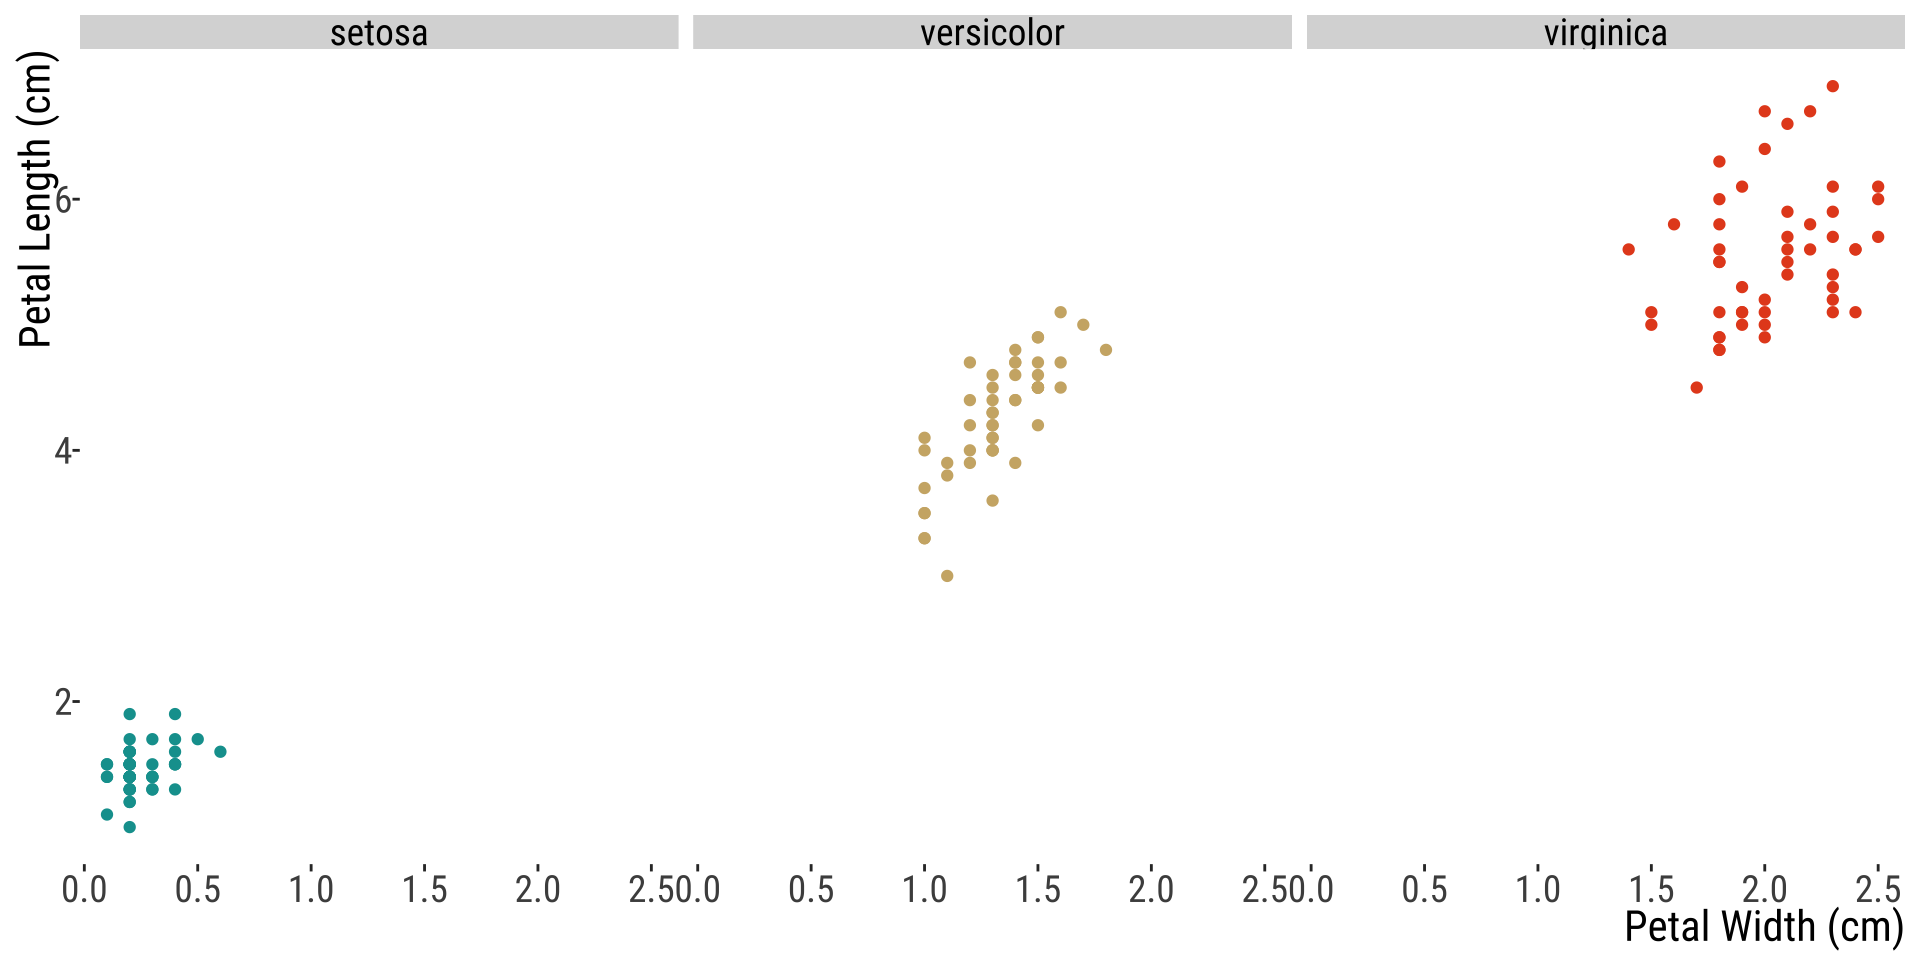
Numerical (2) x Categorical
Multiple scatterplots plotted separately
Visualizations Over Time and Space
Line Graphs Show Data Over Time
For temporal data, note all observations with a data point, and connect each point with a line.
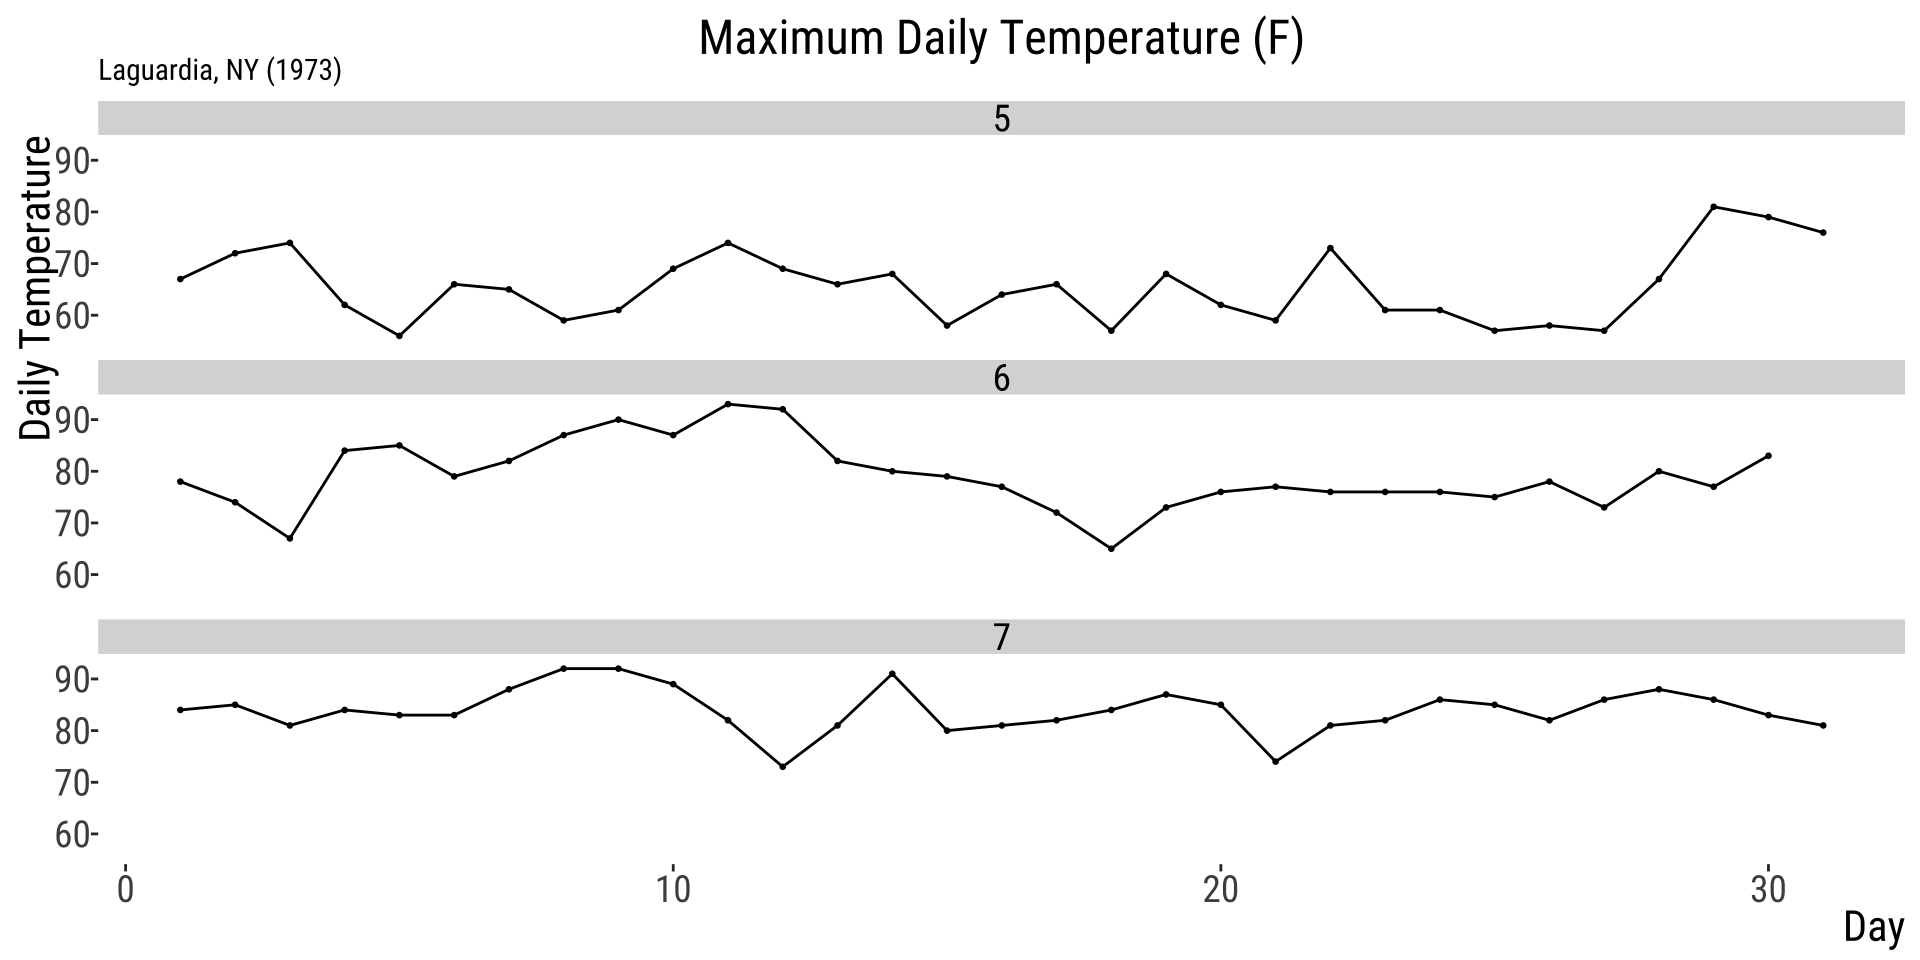
Small multiples line chart
A grid of line charts that uses the same scales and axes
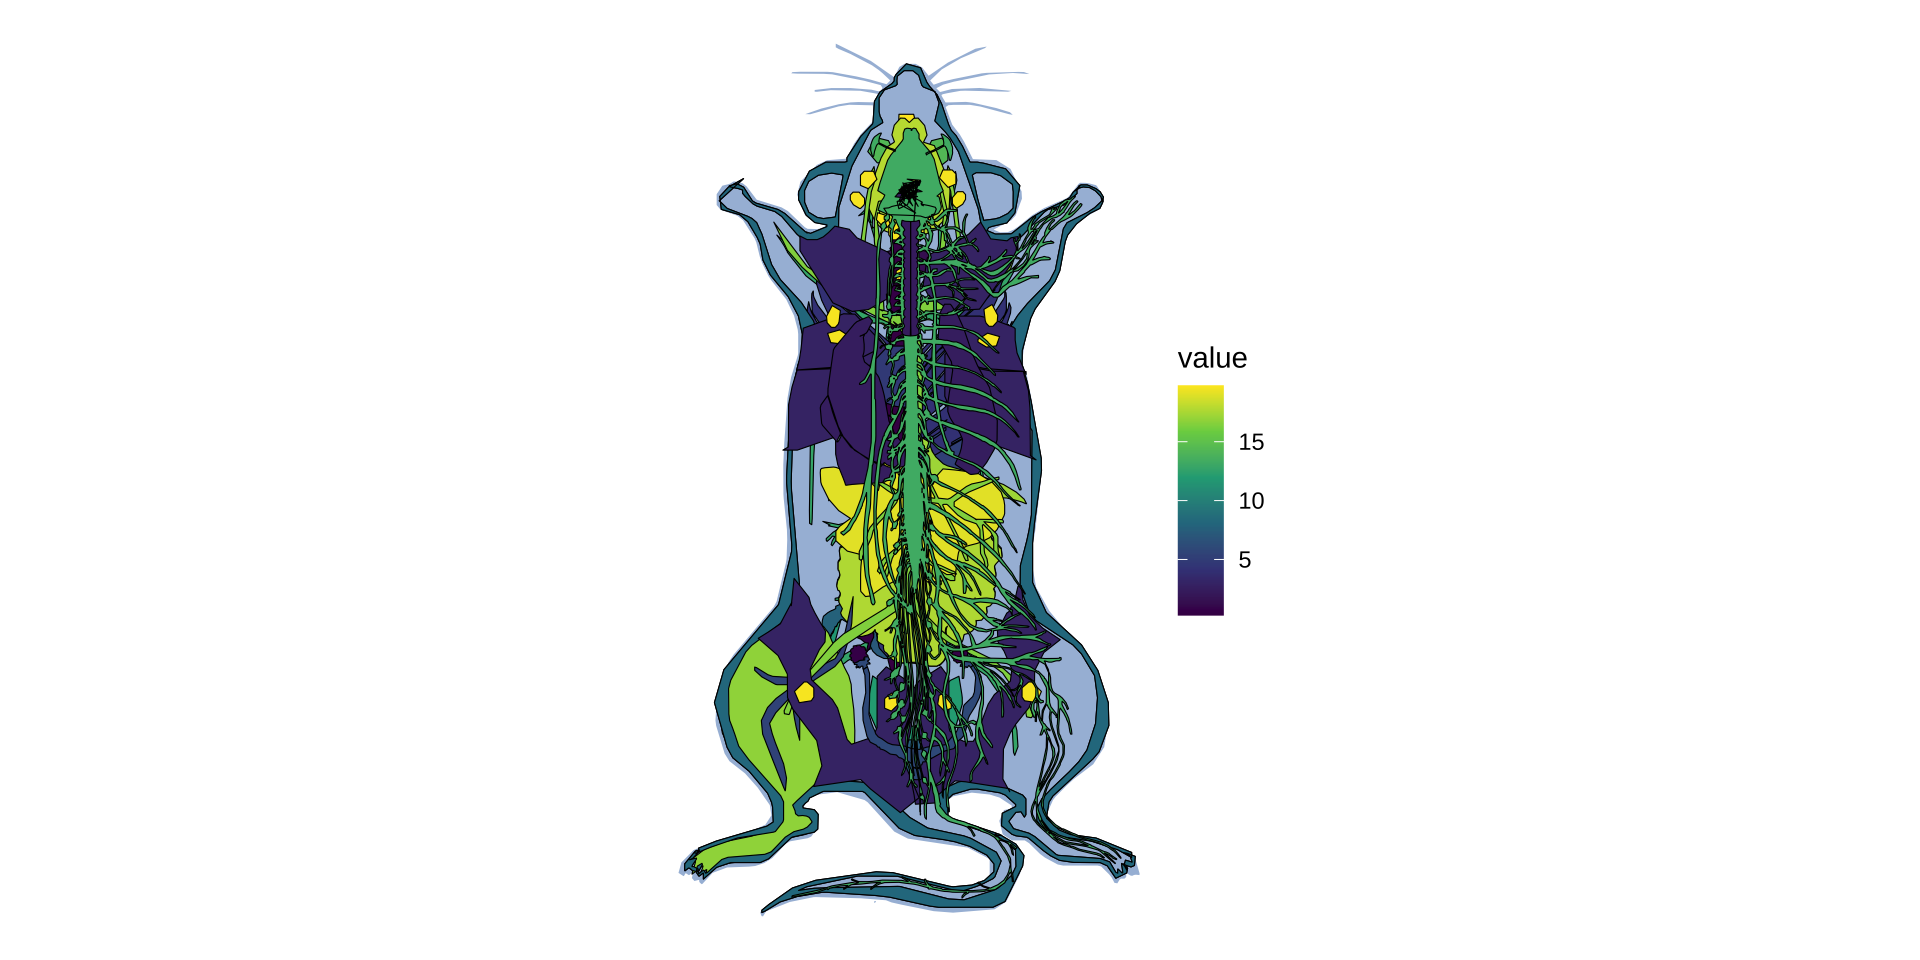
To show spatial data
Maps
Spatial data does not have to be a geographical map
What is the main problem here?
- Hide the data.
- Make patterns hard to see.
- Display magnitudes dishonestly.
- Draw graphics unclearly.
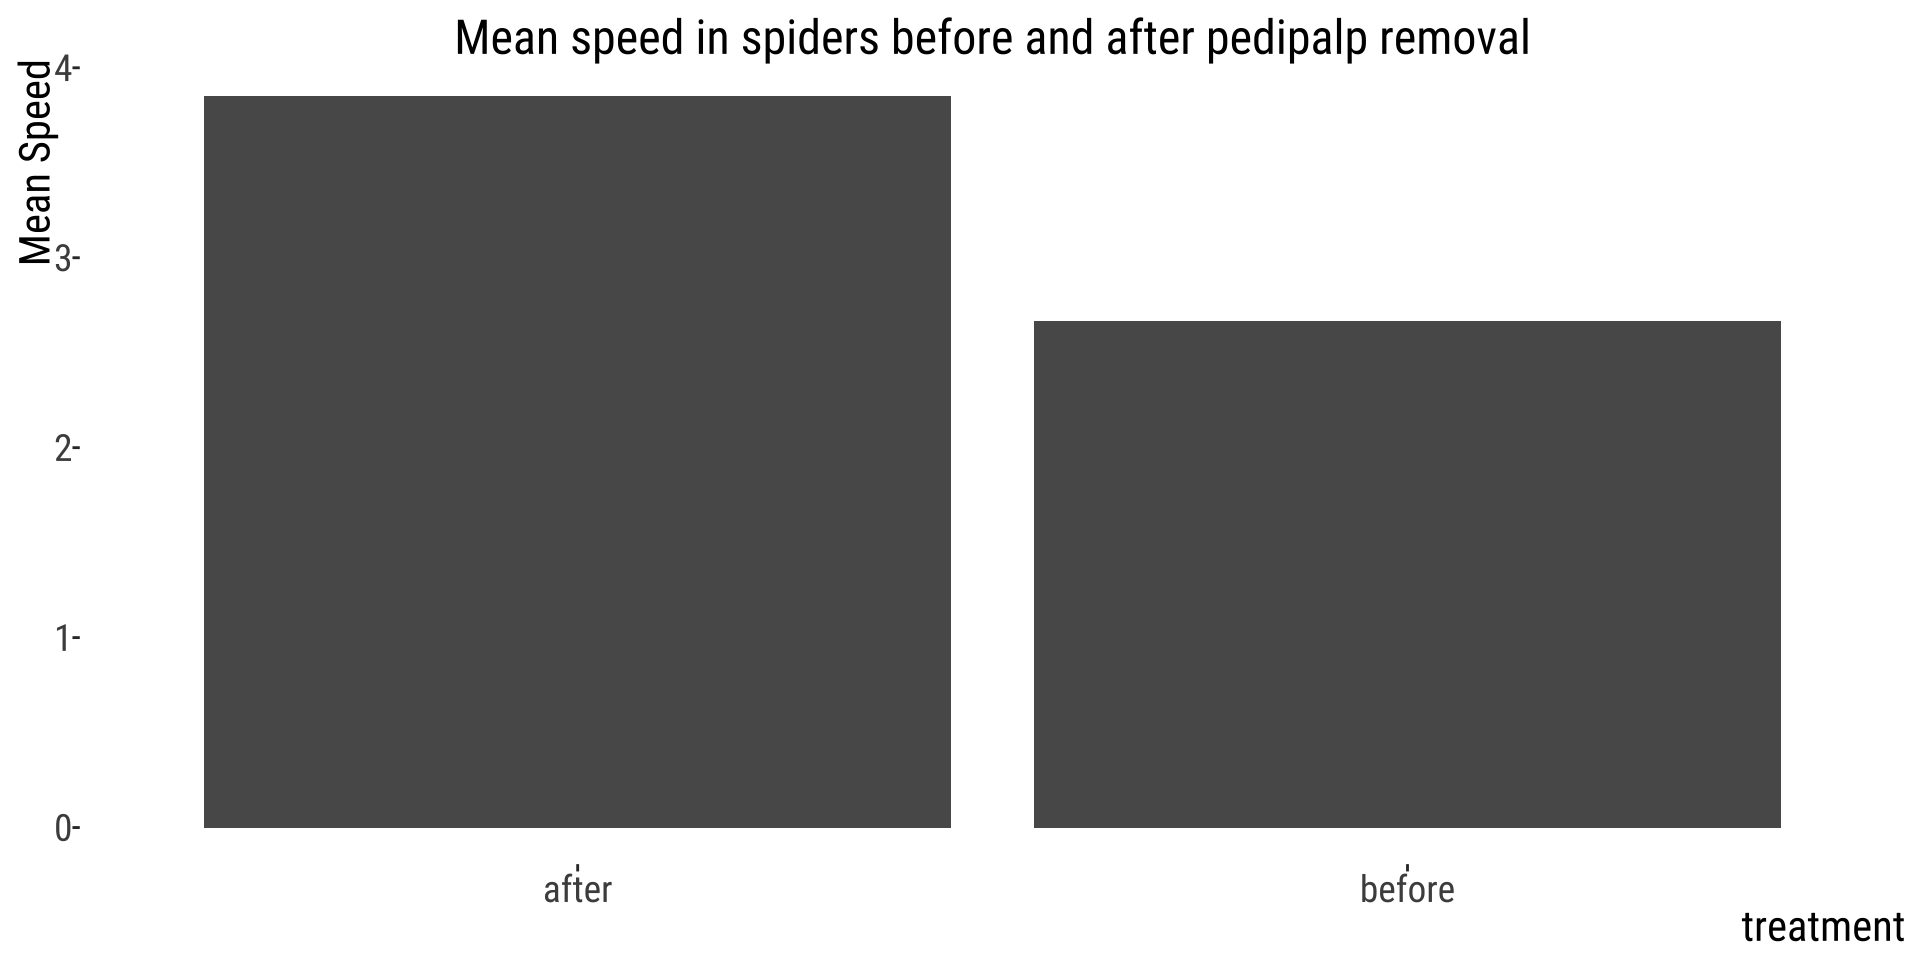
👎 Not showing data, just summaries
- Hide the data.
- Make patterns hard to see.
- Display magnitudes dishonestly.
- Draw graphics unclearly.
This plot hides the variation between positions.

What is the main problem here?
- Hide the data.
- Make patterns hard to see.
- Display magnitudes dishonestly.
- Draw graphics unclearly.

👎 Not showing data, overplotting
- Hide the data.
- Make patterns hard to see.
- Display magnitudes dishonestly.
- Draw graphics unclearly.
Over-plotting hides data by placing data points on top of each other.
👍 Showing data by jittering

This plot shows all the observations
What’s the main problem here?
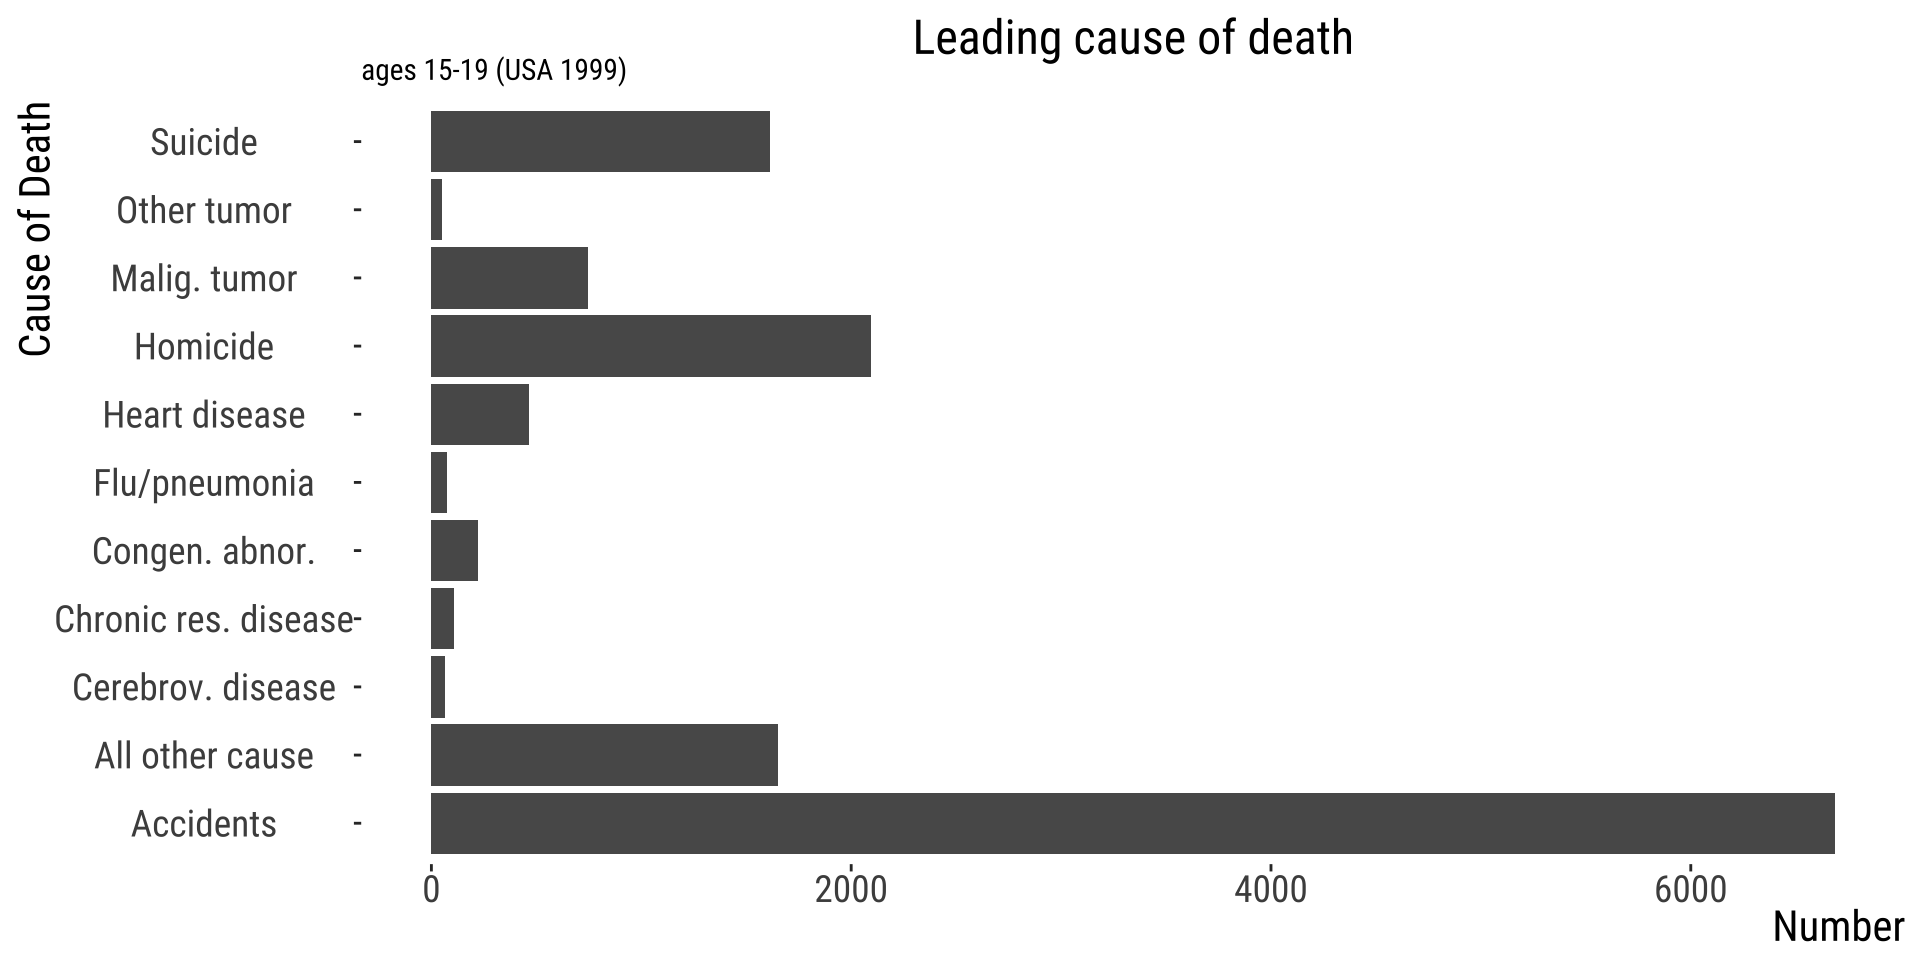
Nonsensical order hides pattern
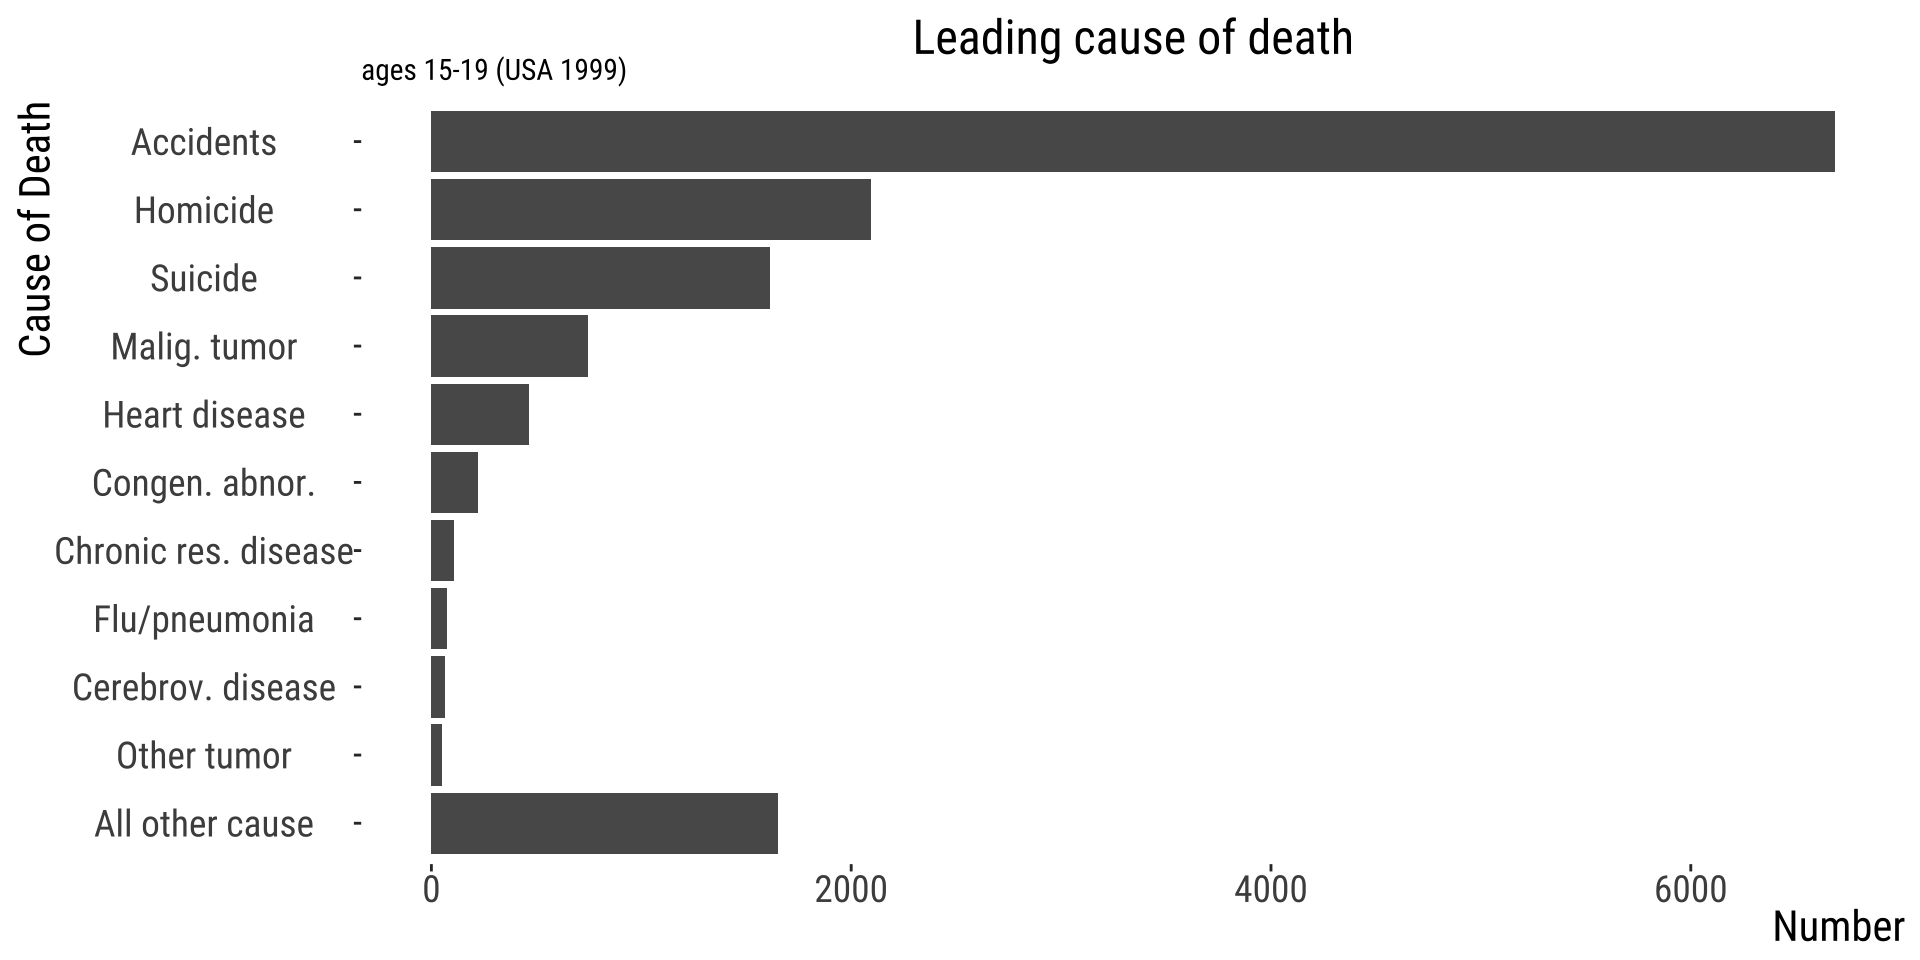
Reordering factors makes pattern clear
Problem?
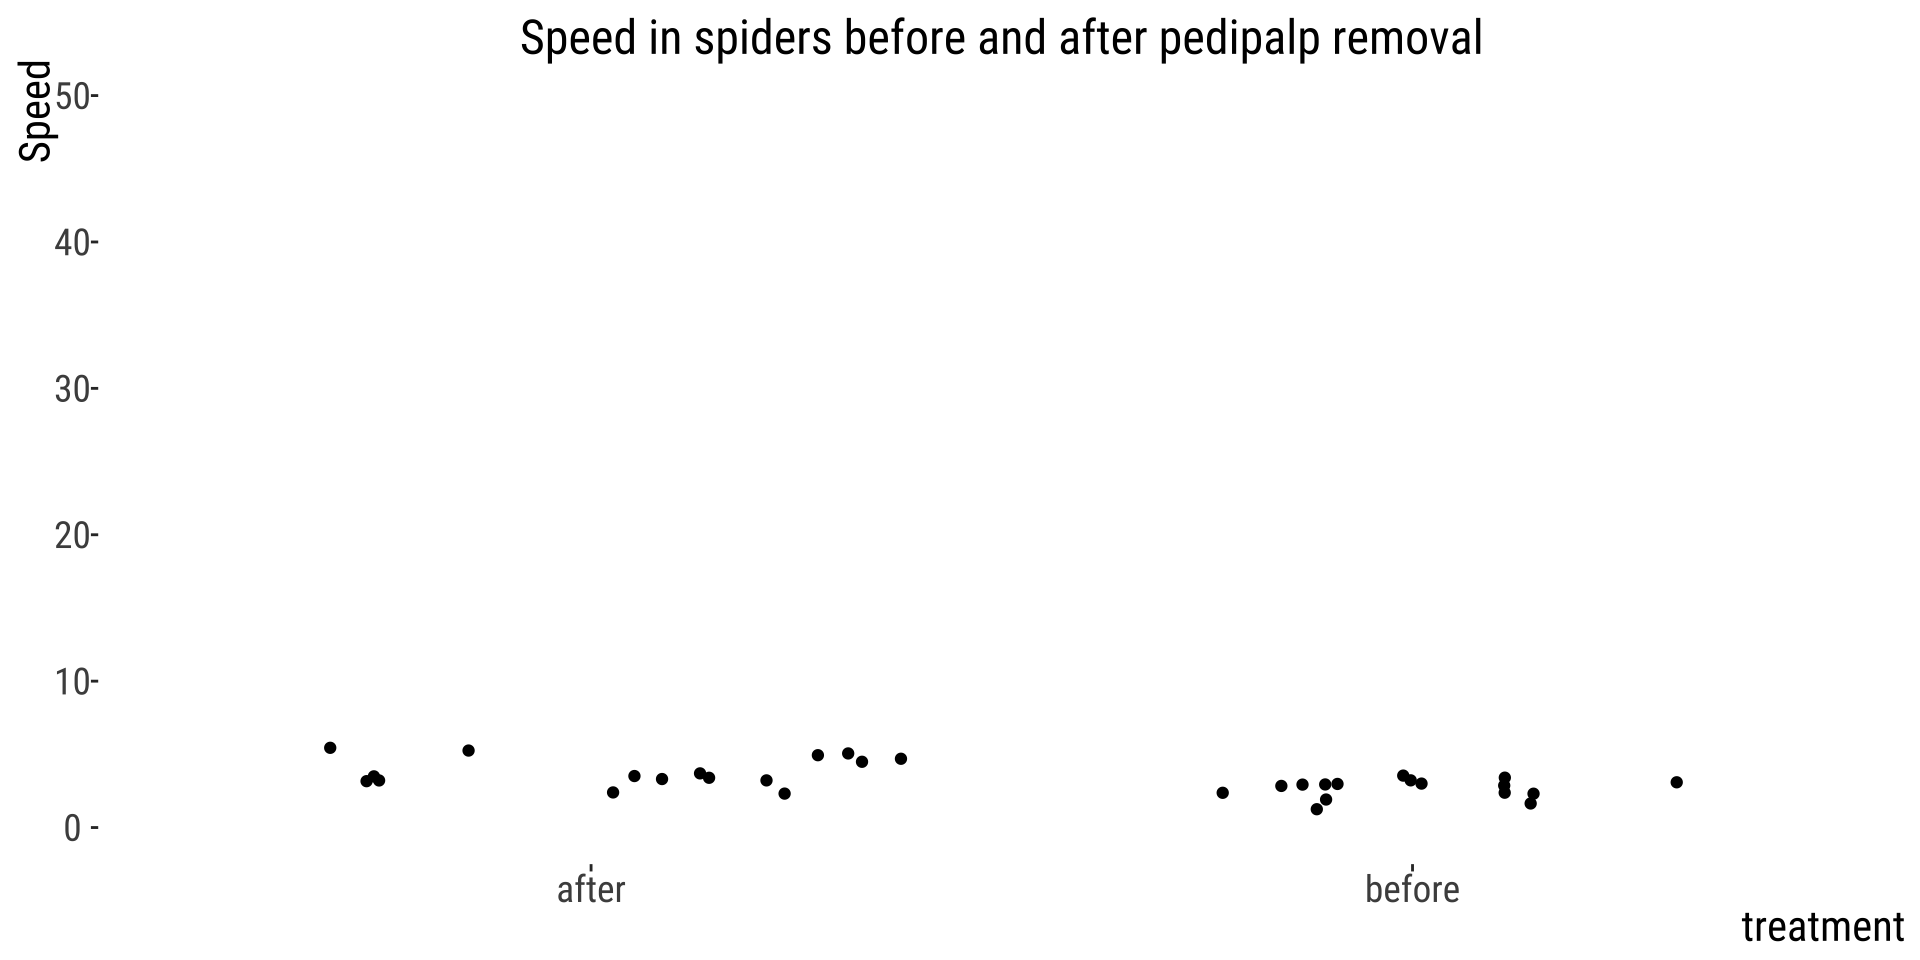
Bad Axis-Limits Hide Patterns 👎
In this plot, the large scale hides the pattern (difference between the two groups)
That’s all for today

From: makeameme.org