4.5.Estimation with Uncertainty
Confidence Intervals
2025-11-05
Pratice question 1
If the 95% confidence interval for a data set is \(15 < \mu < 23\), which of the following are closest to the standard deviation and sample size for the data set? Hint: use the 2SEM rule of thumb.
Practice question 1
If the 95% confidence interval for a data set is \(15 < \mu < 23\), which of the following are closest to the standard deviation and sample size for the data set? Hint: use the 2SEM rule of thumb.
Sample mean is in the middle of the interval, so 23-15=8; 23-4=19; $x = 19 2SEM rule: Lower: \(19 - 2\times SEM_{\bar x}=15\); \(4=2\times SEM_{\bar x}\); \(\frac{s}{\sqrt(n)}=2\) Can’t be
Practice Question 2
What is wrong with this statement?
Measurements of the distance between the canine tooth and last molar for 35 wolf upper jaws were made by a researcher. They found the 95% confidence interval for the mean to be \(10.16 < \mu < 10.47\) and the 99% confidence interval to be \(10.21<\mu<10.44\).
These cannot both be true because for a given sample the 99% CI MUST BE wider than the 95% CI.
CI Web Apps:
I highly recommend using these:
Web app from the book: http://www.zoology.ubc.ca/~whitlock/Kingfisher/CIMean.htm Note: this uses the method involvign the Normal distribution. If you click on calculations you will see it. We will learn that later.
And this one: https://shiny.abdn.ac.uk/Stats/apps/app_sampling/ This allows you to do something very similar as to what I did in the slides, step by step.
CIs from bootstrapping
This is a great choice because it does not make any assumptions about underlying distributions.
Recipe for non-parametric bootstrapping:
- Take a sample of given size (in our example, \(n=100\) genes)
- From this sample, take \(R\) equally-sized (\(n=100\)) samples (with replacement) and calculate the statistic of interest (mean gene length)
- Repeat many times (e.g. 10,000)
- The distribution of mean gene lengths approximates the sampling distribution nicely.
We will do this in lab.
Sampling Distribution vs. Bootstrap Distribution
Sampling Distribution
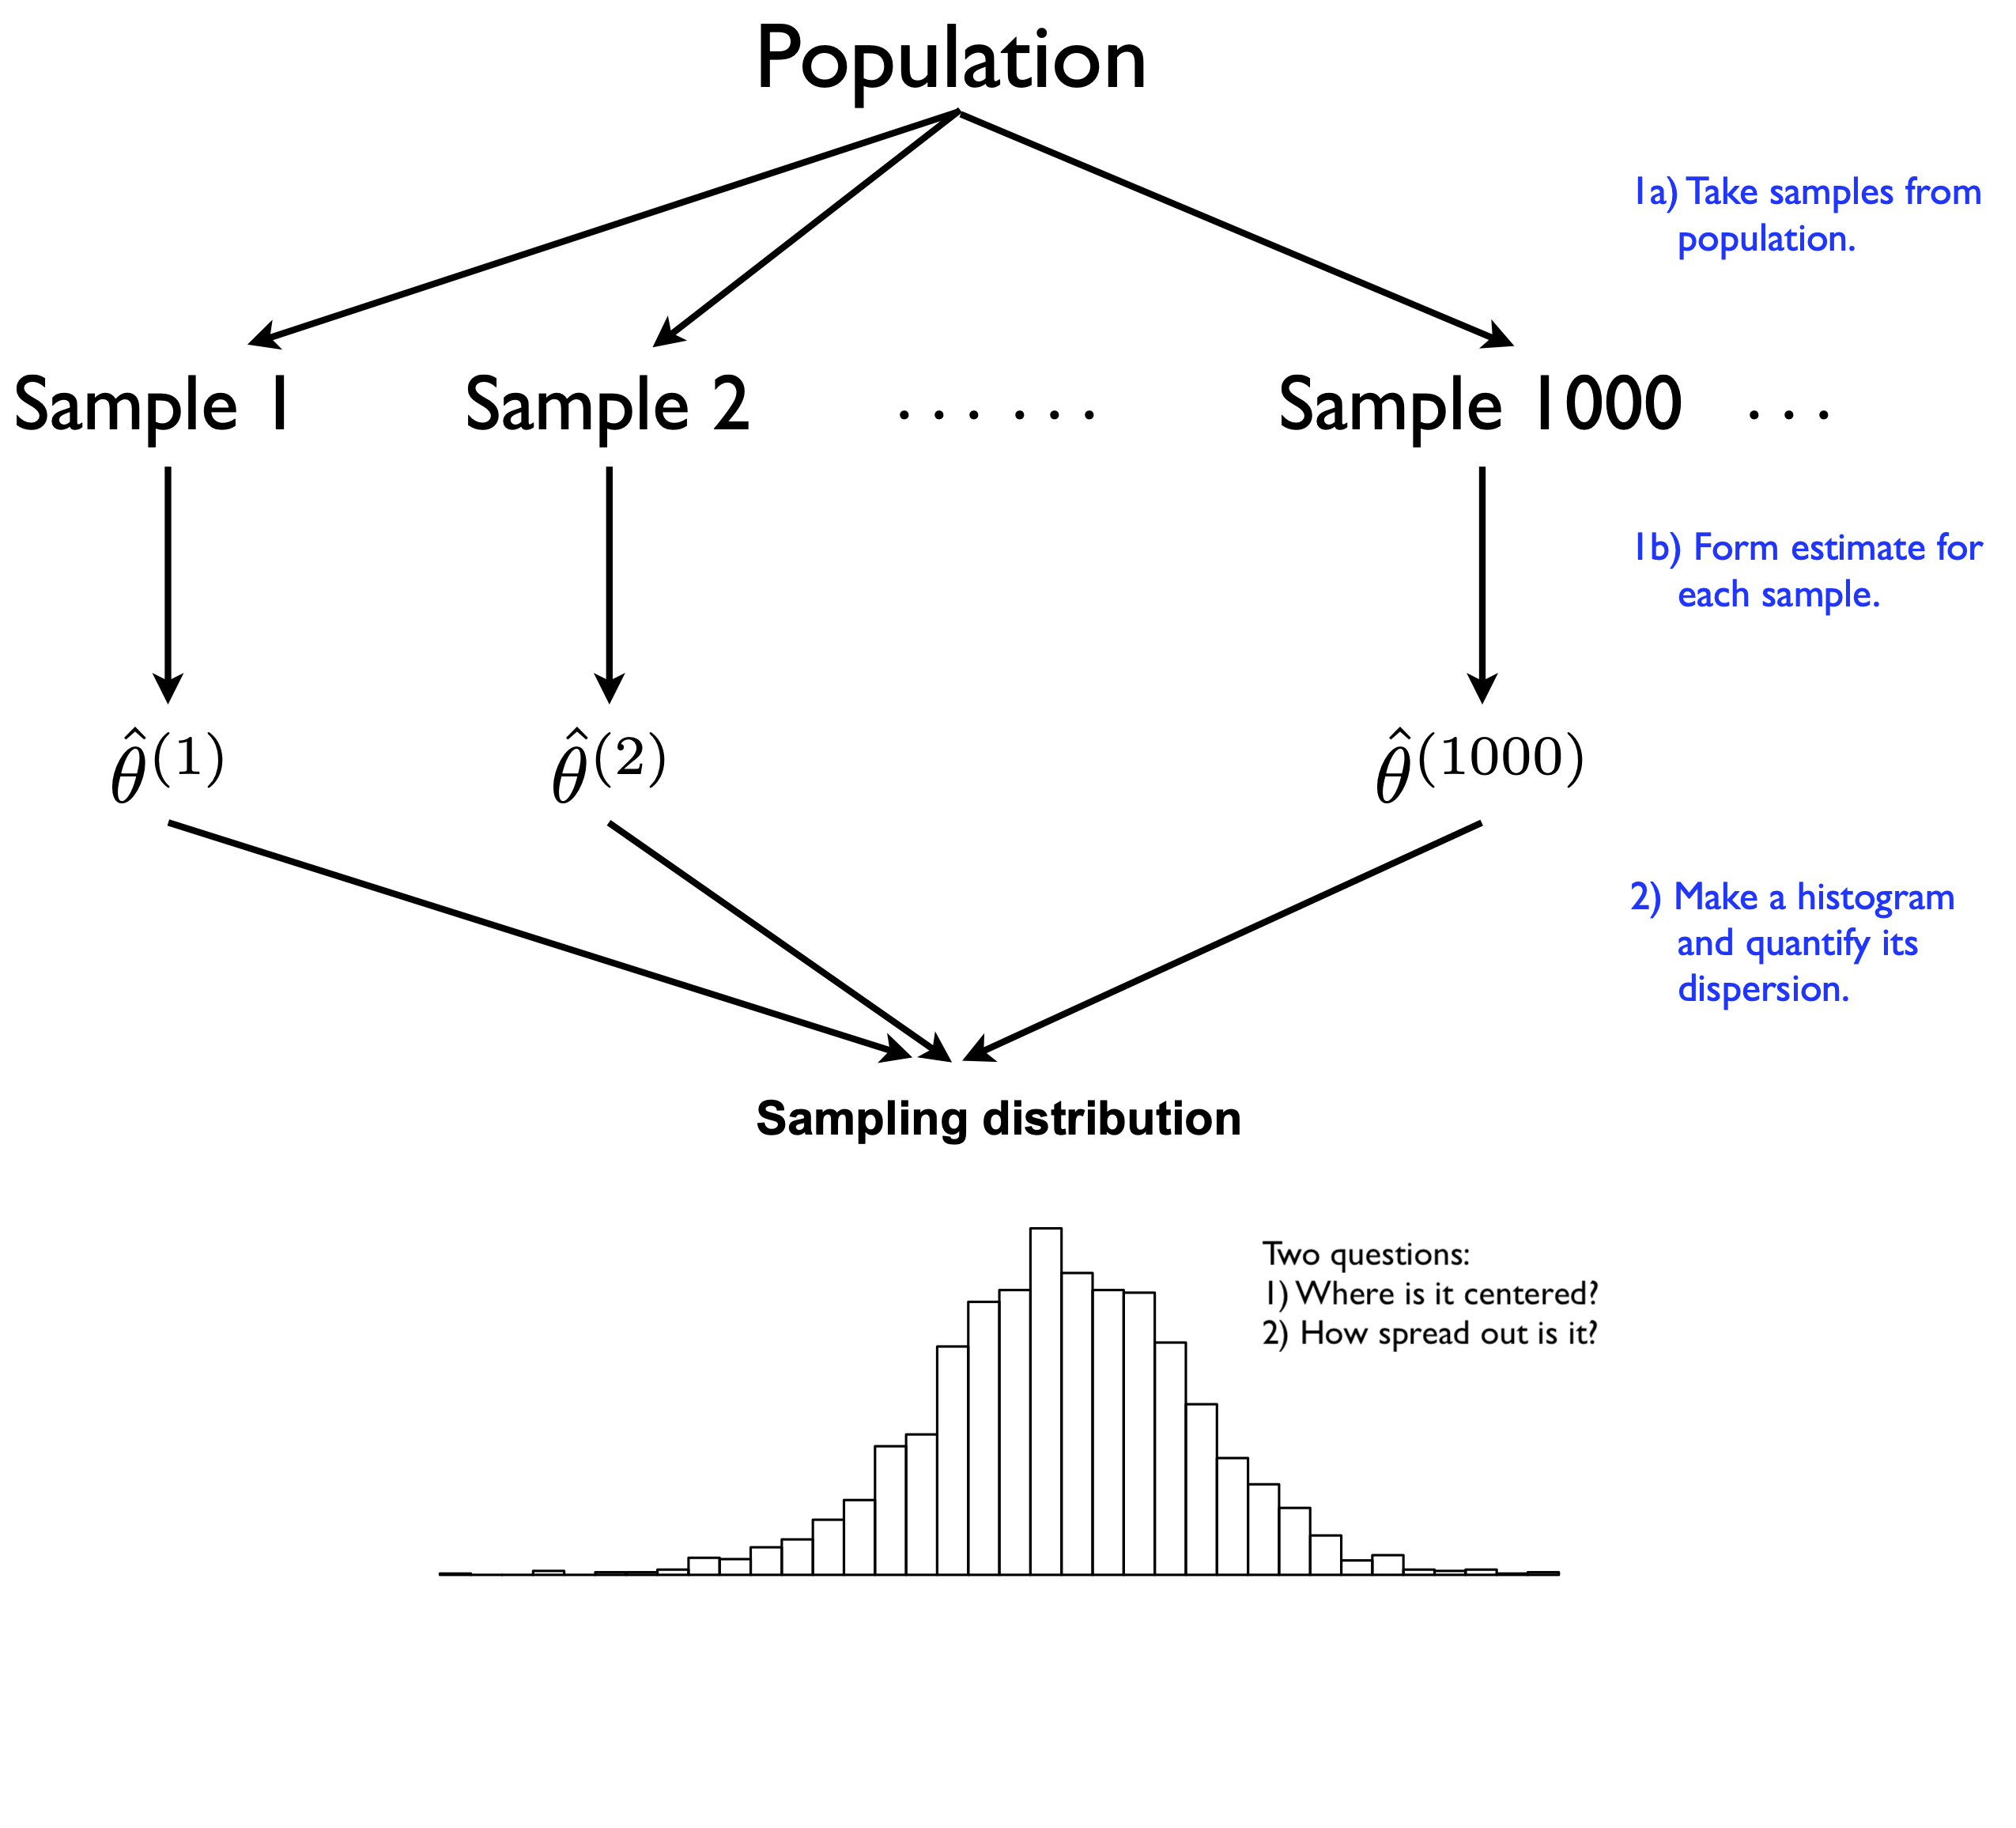
Of course, if you really could peer into all those parallel universes, each with its own sample from the same data-generating process, life would be easy. 1
But not all is lost!
Even if you can’t repeatedly go to the population and sample over and over again
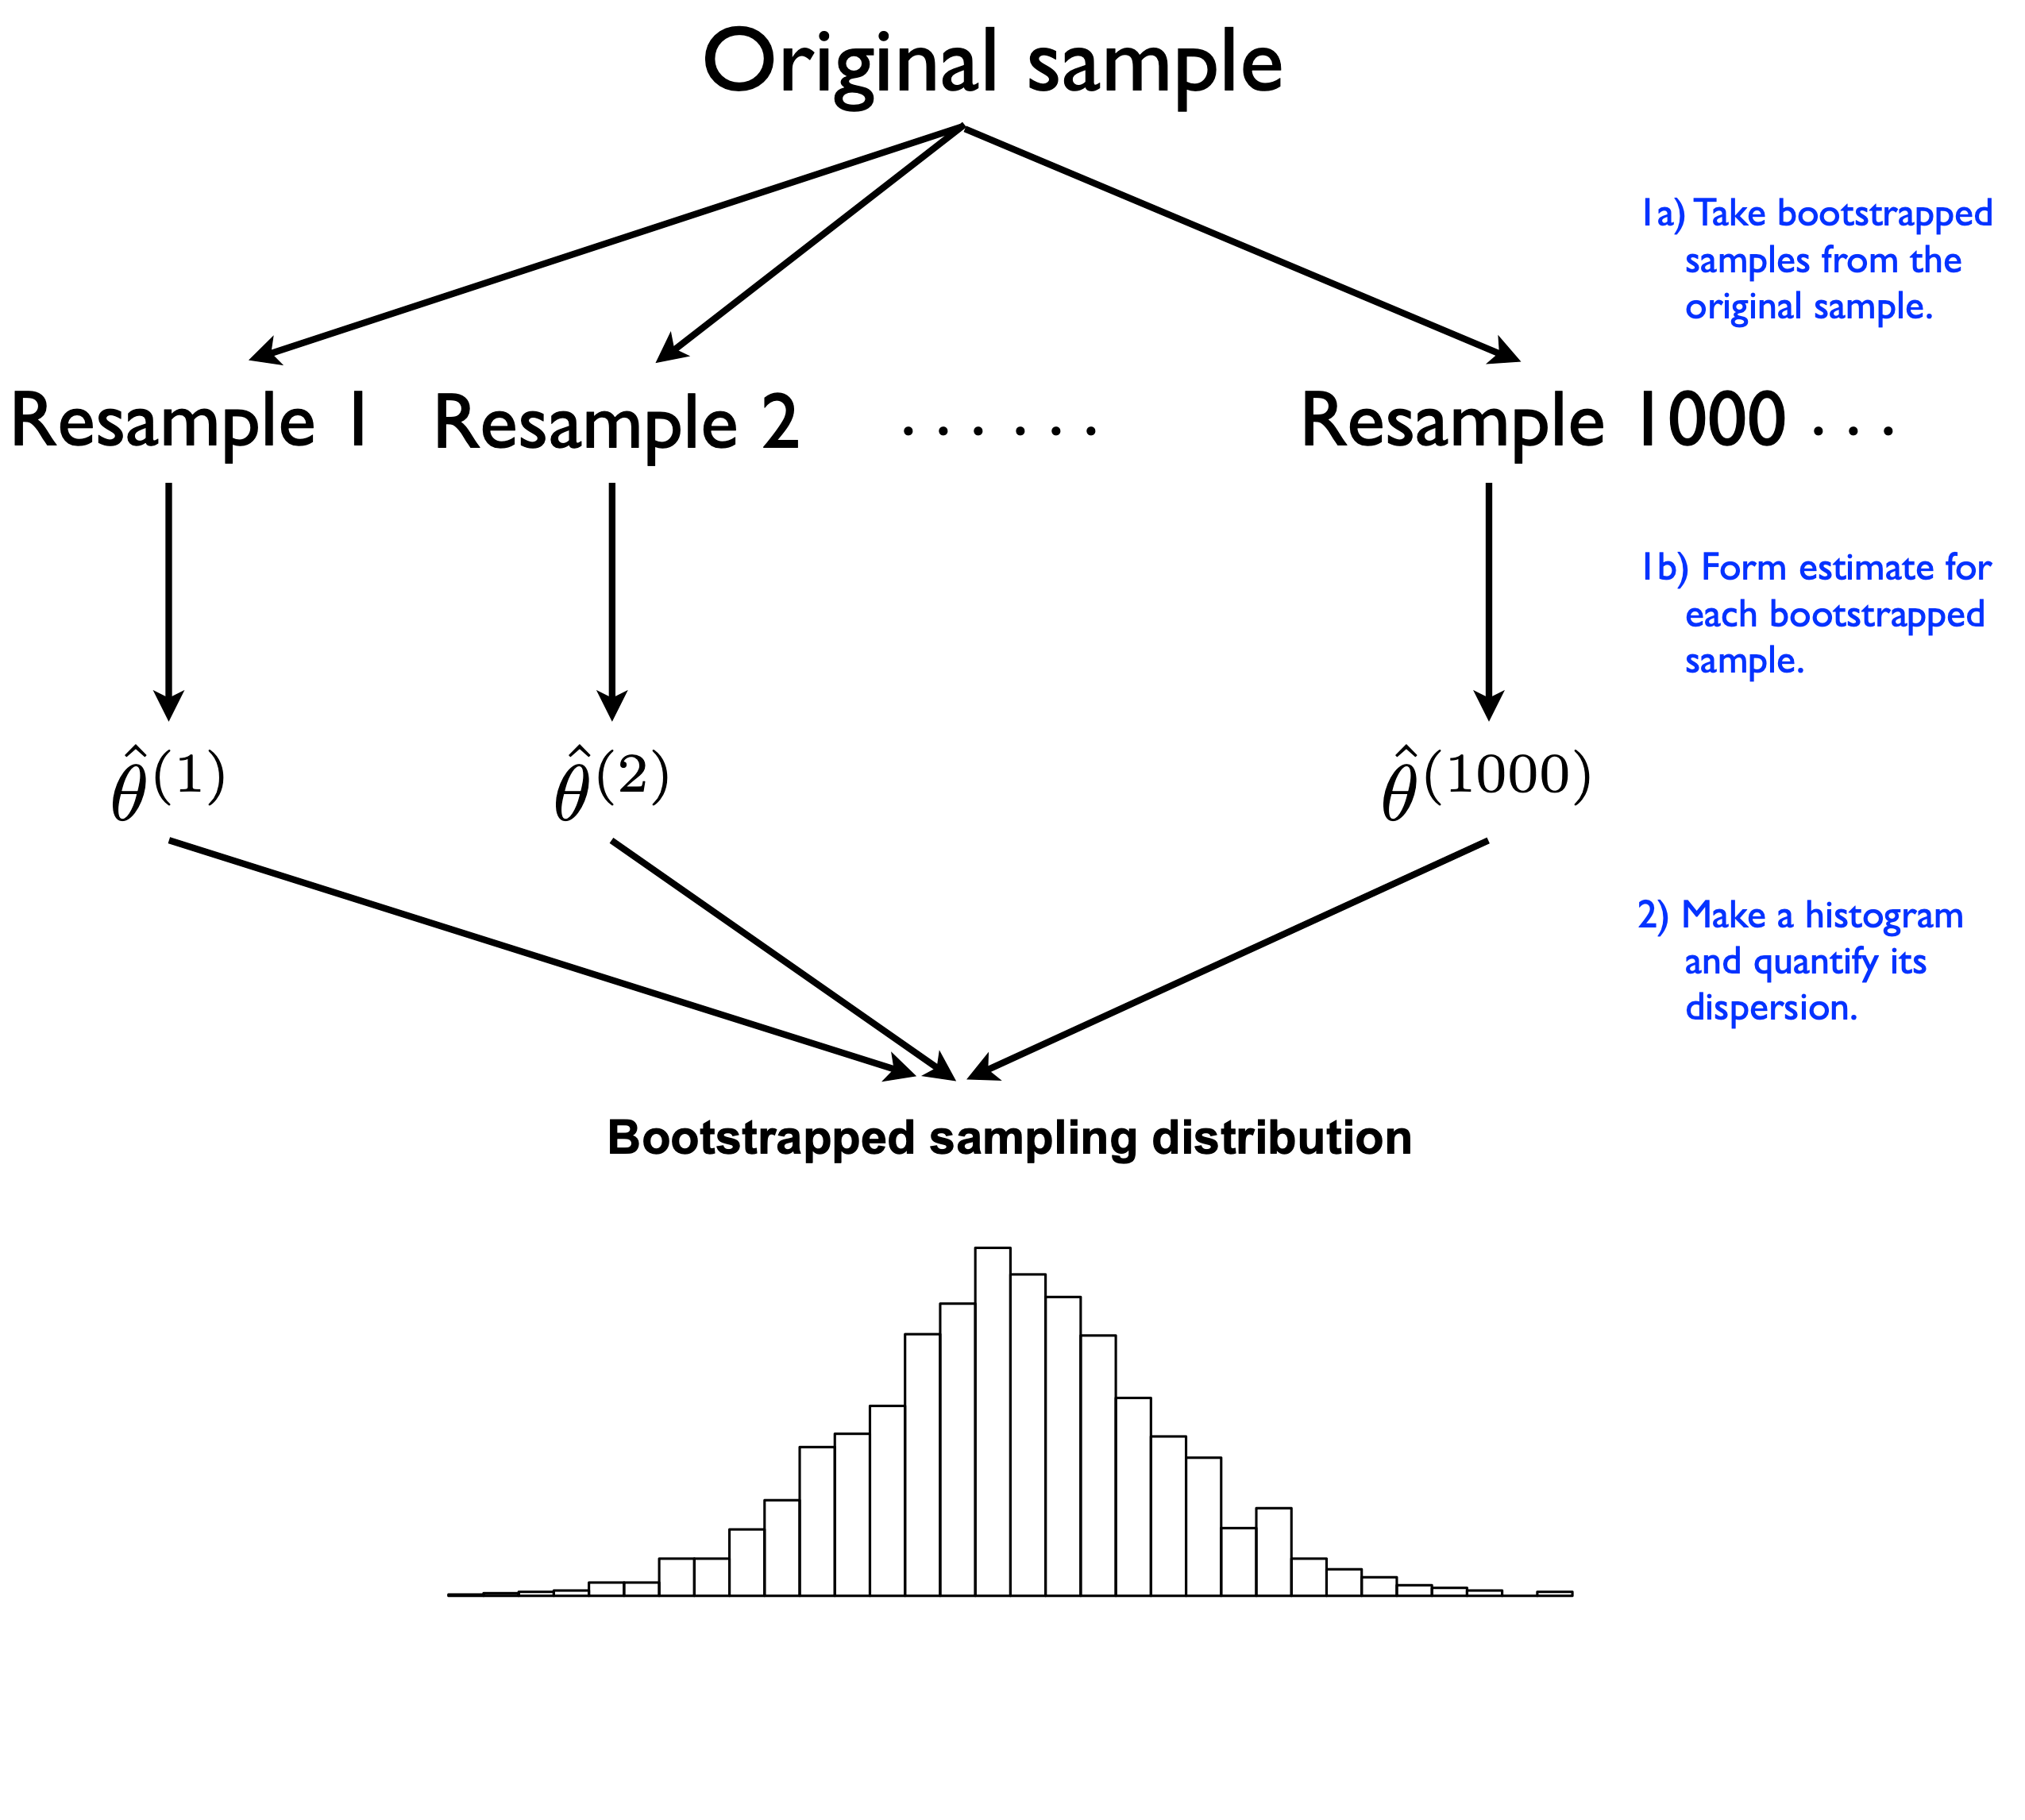
How? By pretending that the sample itself represents the population, which allows one to approximate the effect of sampling variability by resampling (with replacementt) from the original sample. This is “bootstrap resampling” or, simply, “bootstrapping”.
CI: Q&A to answer your burning questions
CI: Q&A
Q: When can I use the rule of thumb that the CI equals the sample mean plus or minus 2 SDs?
Never! In a Gaussian distribution you expect about 95% of the individual values to lie within 2 SD of the mean. But the idea of a CI is to quantify how precisely you know the population mean. For that, you need the sample size to be taken into account.
Q:When can I use the rule of thumb that the CI equals the sample mean plus or minus 2 SEM?
When \(n\) is sufficiently large and the population variable of interest is normally distributed (approximately). We will come back to this. If in doubt, don’t use it!!! [if you do, acknowledge this shortcoming]
PSEUDOREPLICATION: WHEN YOUR CONFIDENCE IS UNDESERVED
What is pseudoreplication?
Pseudoreplication is the error that occurs when samples are not independent, but they are treated as though they are.
Thus the sample size is smaller than claimed.
Pseudoreplication provides a false sense of high certainty.
This is not an uncommon issue in published papers.
Example
You are interested in estimating the average pulse rate of mountain climbers. Since they are hard to find, you decide to take 10 measurements from each climber. You study 6 climbers, so you have 60 measures. What is your sample size (n)?
It’s 6. But you can and should use the extra data. How? Take the mean for each climber, so that you have 6 pulse rates, one for each climber (\(n=6\)).
This is a simple example but, in practice, pseudoreplication is hard to identify and things differ by field
Pseudoreplication problems arise from the organisational complexity of life itself. (Lazic et al. (2018)
Requirements for genuine replication
The best place to start: think about what are the biological and experimental units of your and look for field specific discussion on the topic. E.g., this publication talks about this pseudoreplication in cell culture and animal experiments:
To ensure (…) results can be extrapolated to the population of interest, there must also be replication relevant to the hypothesis being tested. (…) define the scientific or biological unit of interest, which is the entity (i.e., people, animals, and cells) that we would like to test a hypothesis or draw a conclusion about. (…) to conclude that a drug is better than a placebo, a large number of patients are required because the hypothesis is about patients. We cannot give Jim the drug and Bob the placebo, take a daily measurement for several weeks, and then make general conclusions about the drug’s efficacy. 1
Estimation - Summary
Parameter estimates are influenced by chance.
The sampling distribution considers what could have happened upon sampling.
The standard error is the standard deviation of the sampling distribution.
If producing a real sampling distribution is not possible, a bootstrapping distribution based on the original sample tends to be very similar to the real sampling distribution.
Confidence intervals bound plausible parameter values.
Uncertainty decreases and precision increases with sample size.
Add error bars to graphs to illustrate standard errors or confidence intervals. Make sure to clarify which is being illustrated in the figure legend.
That’s all for today

From: makeameme.org
B215: Biostatistics with R