1.1.Statistics and Samples
Acknowledgments to Y. Brandvain, Freeman & Company, and M. Whitlock for some materials used in these slides
2025-09-03
Overview
- Goals of statistics
- Populations and Samples
- Statistics and parameters
- Estimate errors due to sampling
- Types of experiments
- Types of variables
Learning Goals
- Understand the major goal of statistics
- Distinguish between a sample and a population
- Distinguish between an estimate and a parameter
- Identify why estimates from samples may deviate from parameters of populations
- Identify the properties of a good sample
- Be able to detect the differences between observational and experimental studies
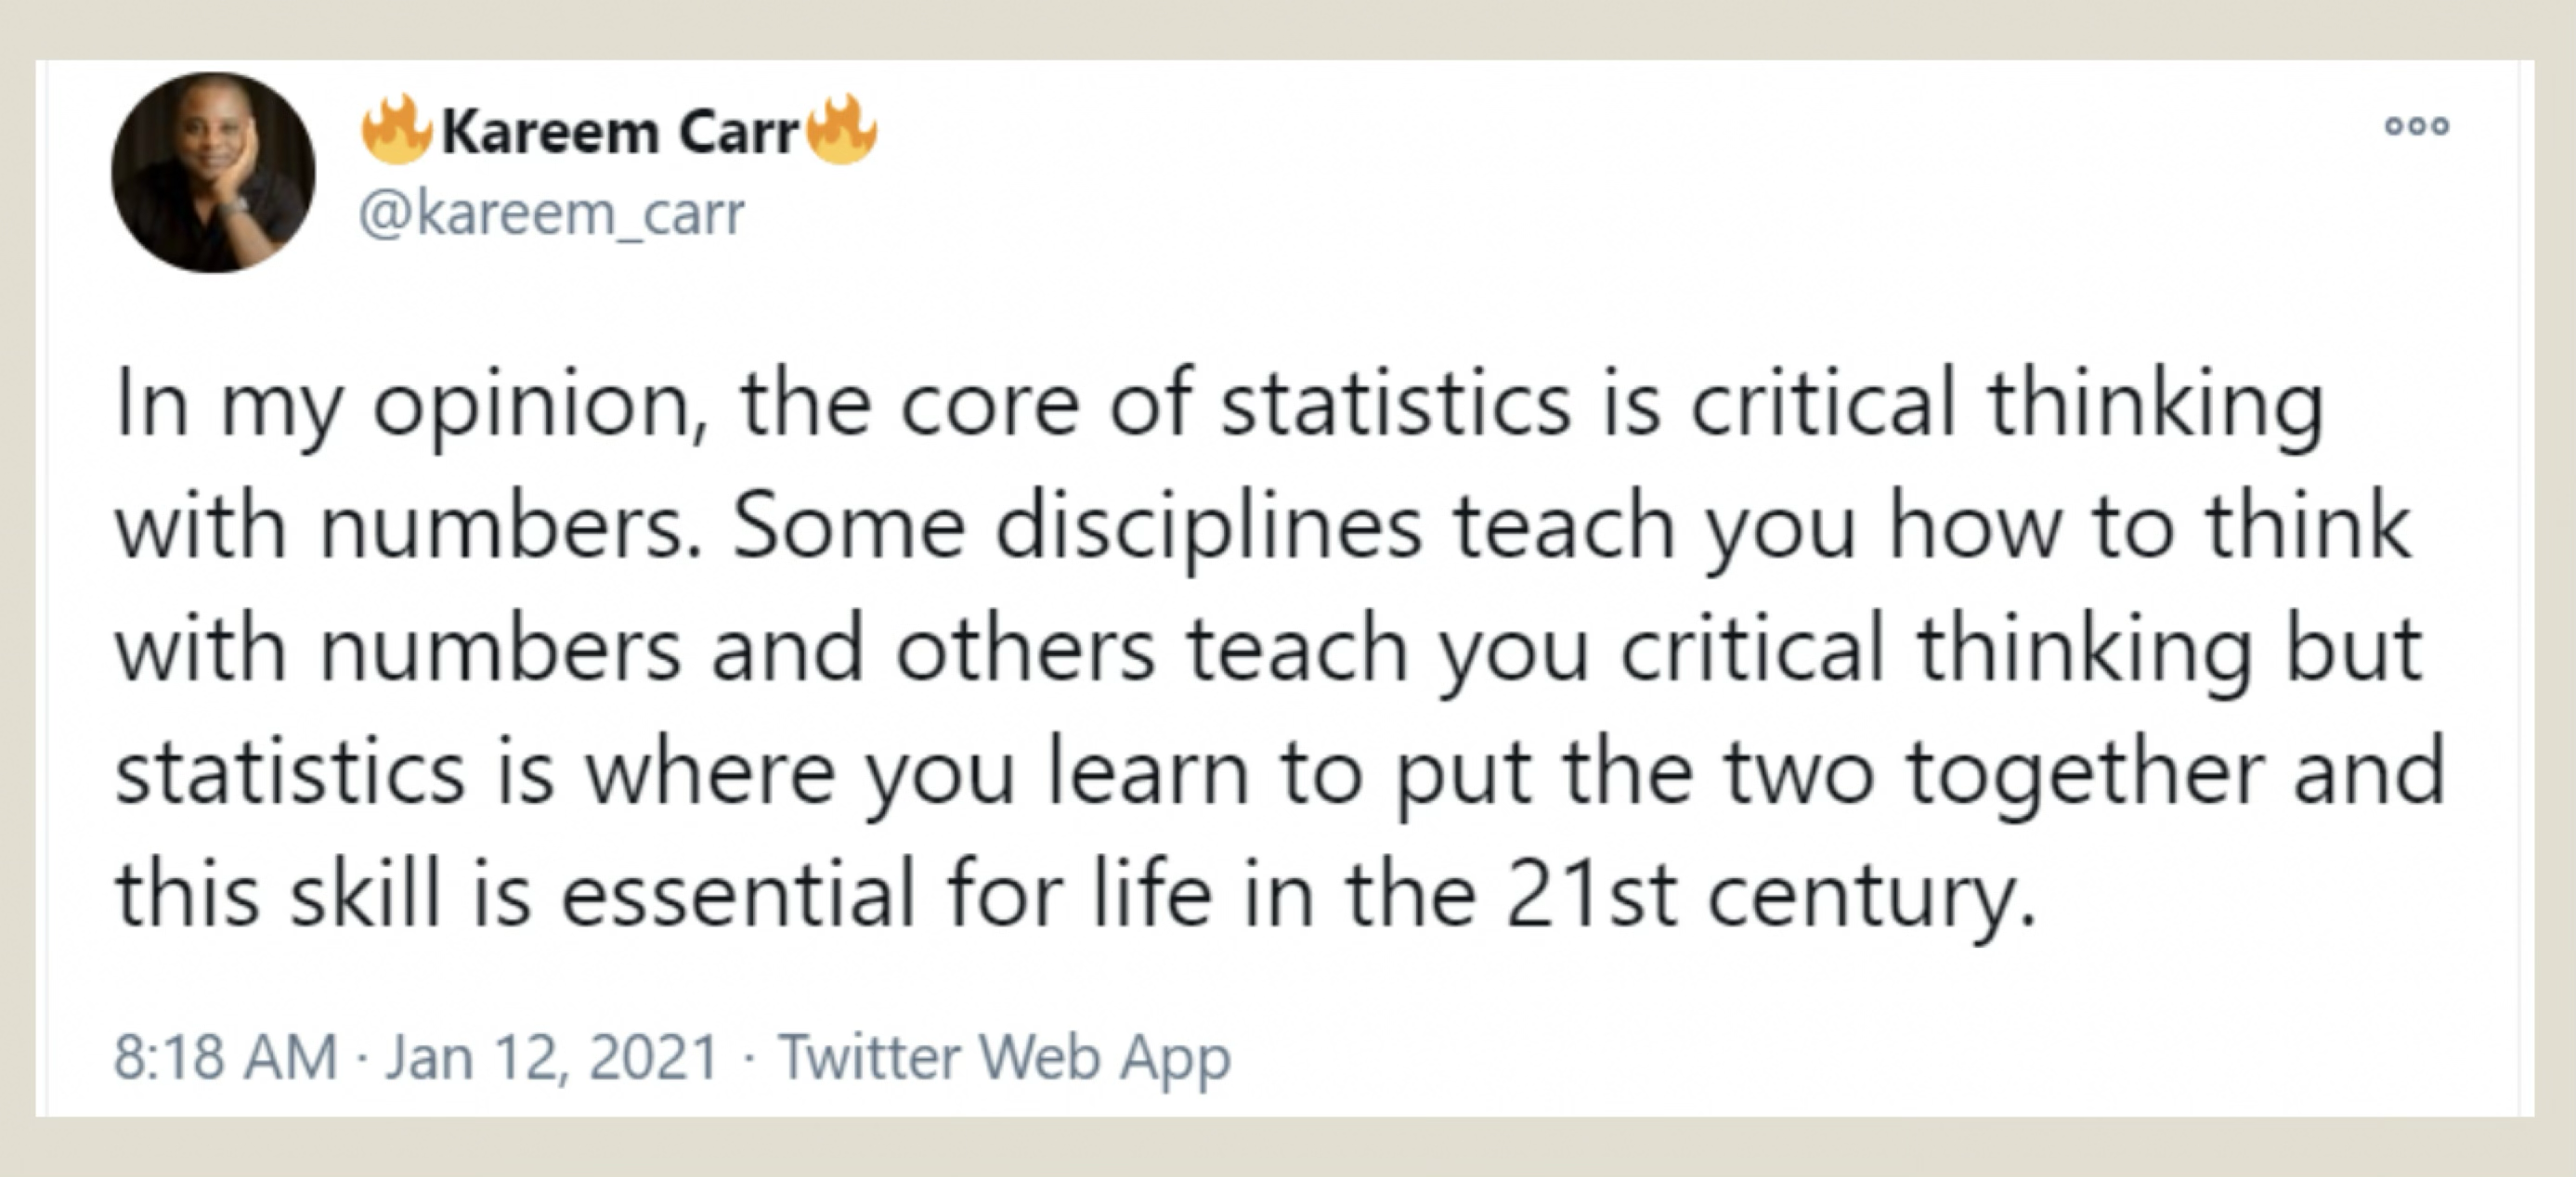
What is statistics?
![Tweet by user @kareem_carr: “In my opinion, the core of statistics is critical thinking with numbers. Some disciplines teach you how to think with numbers and others teach you critical thinking but statistics if where you learn to put the two together and this skill is essential for life in the 21st century.” (January 12, 2021)]()
Tweet from someone I don’t know, but very on point, so thank you!
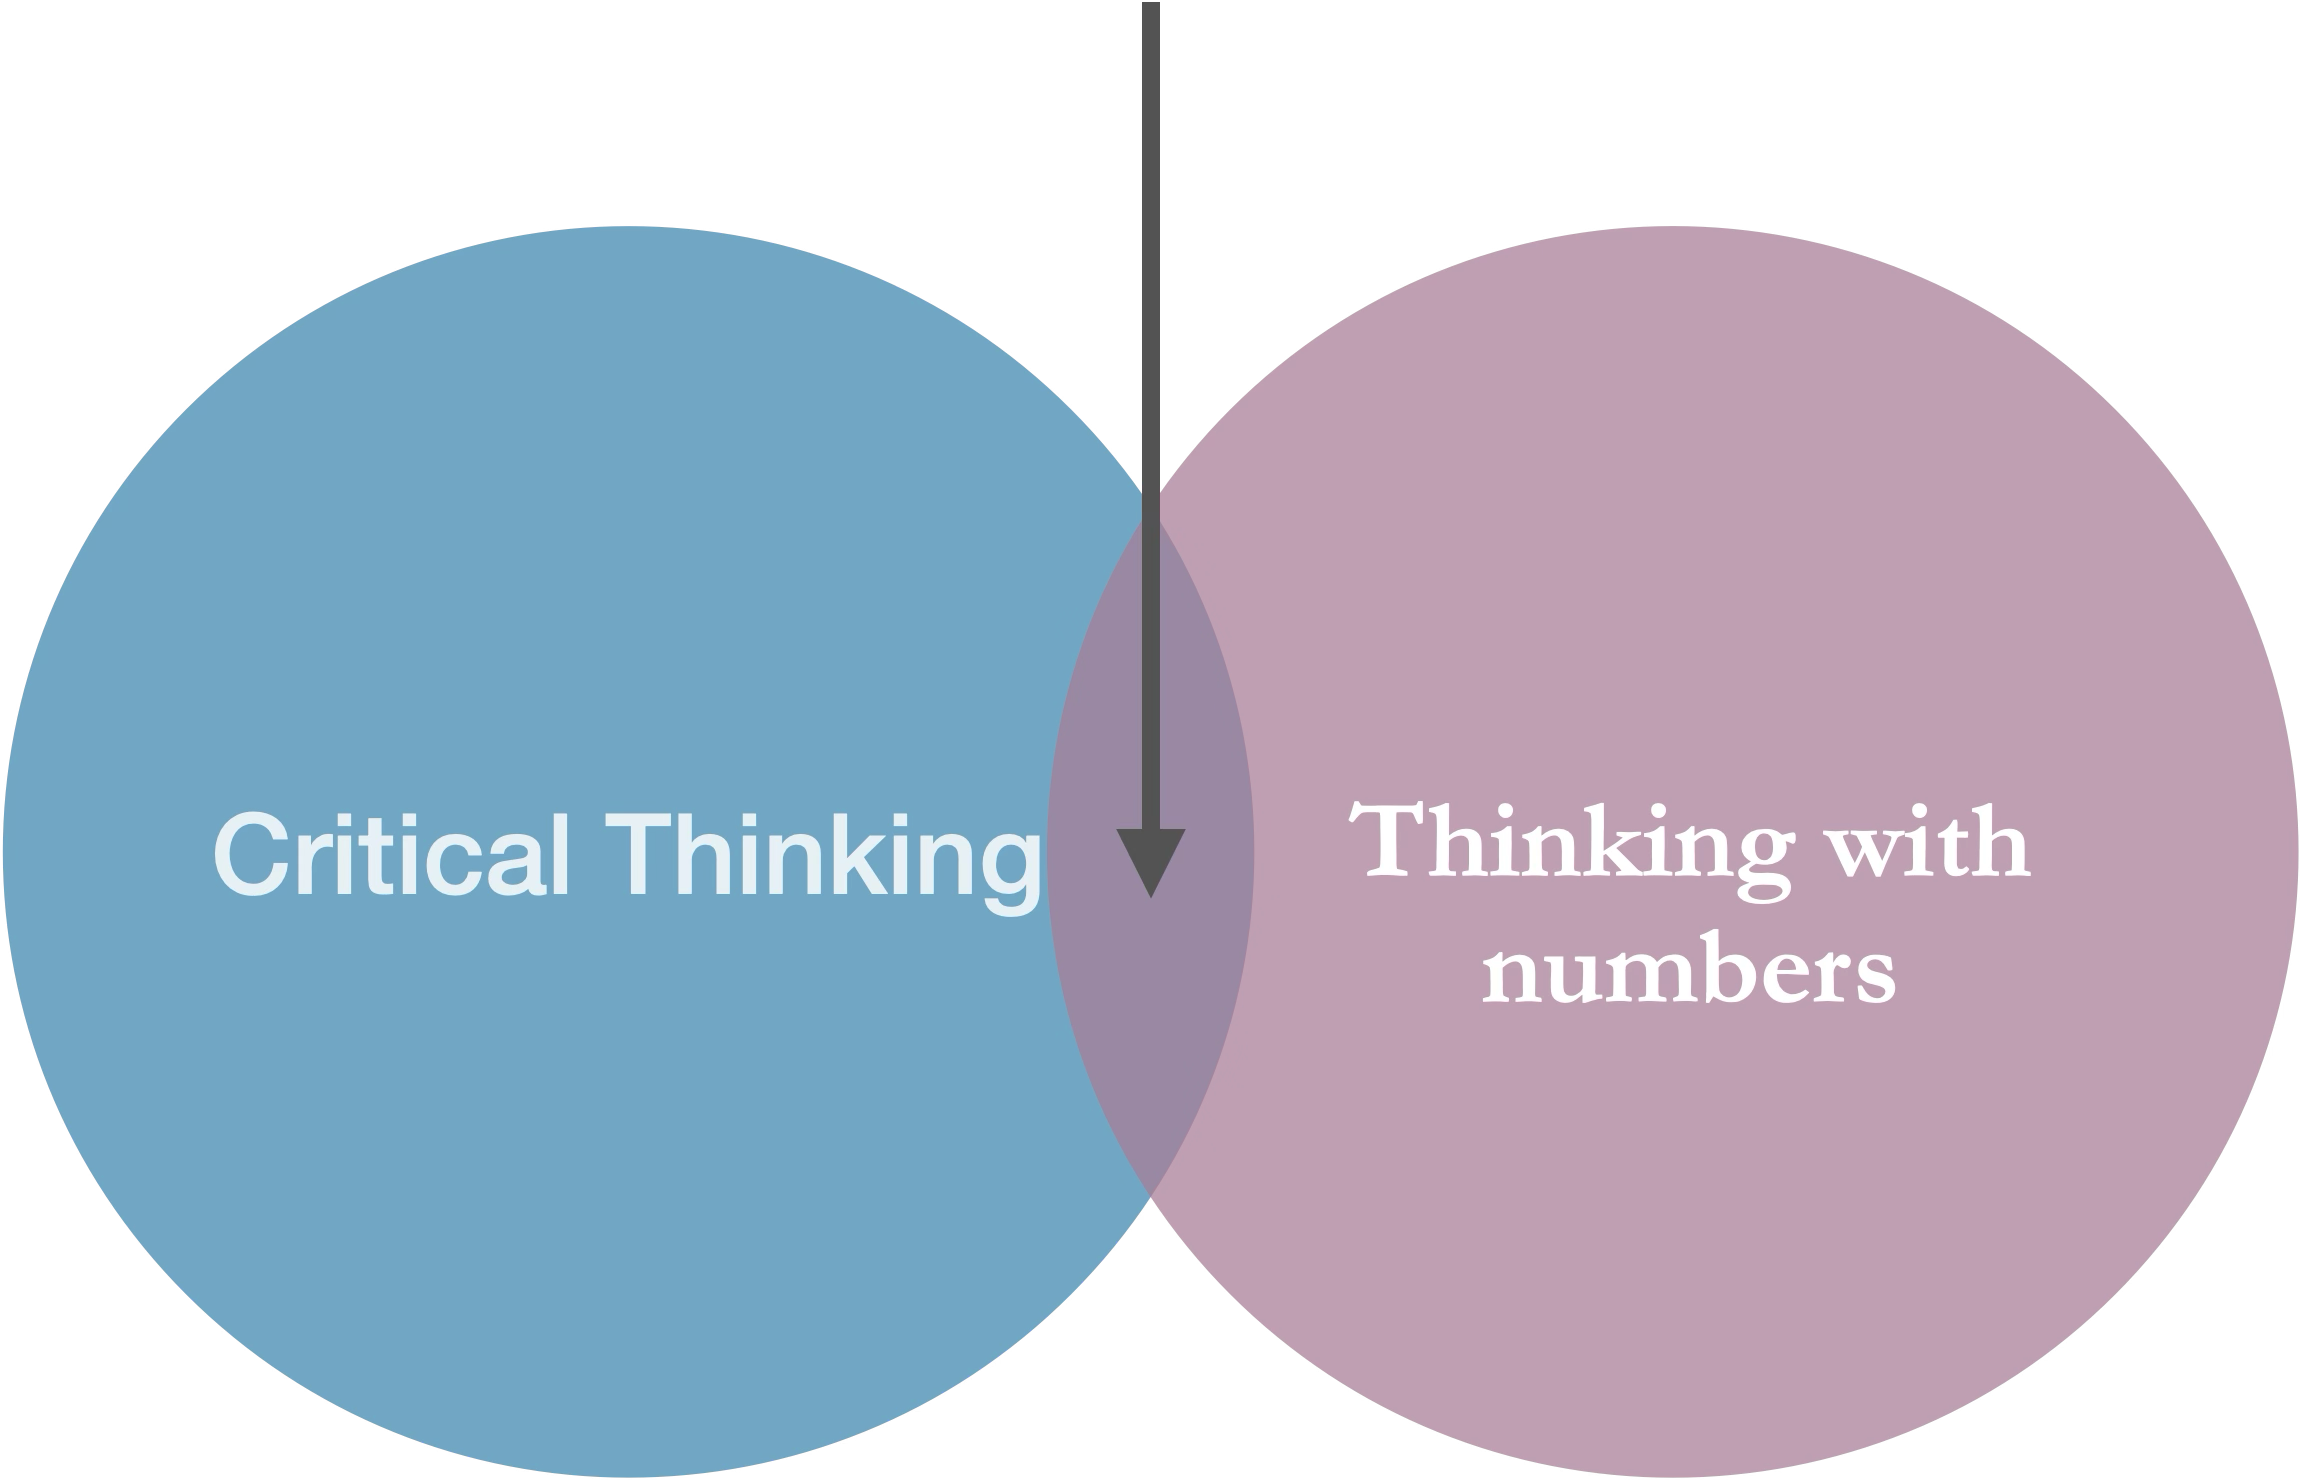
What is statistics?
![venn diagram shows statistics as the intersection of critical thinking and thinking with numbers]()
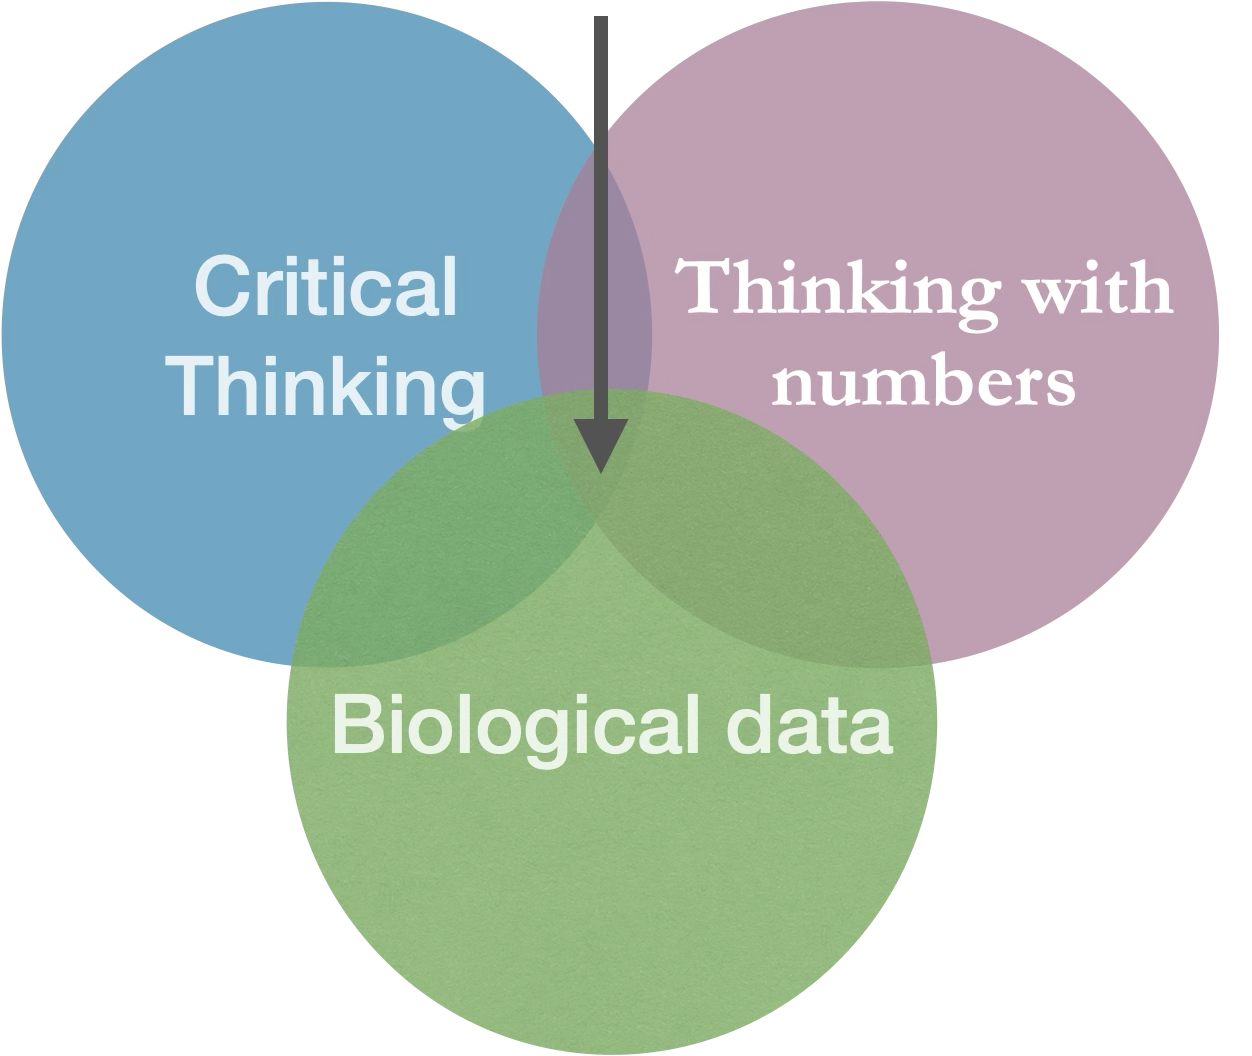
What is BIOstatistics?
![venn diagram shows biostatistics as the intersection of critical thinking, biological data, and thinking with numbers]()
Why should you care about statistics?
- Biology (ecology, genetics, immunology, microbiology, …)
- Biomedical sciences
- Public health
- Data science
- Economy, Psychology, Social Science
Why should anyone care about statistics?
- Good science!
- Critical evaluation of “scientific evidence”
- Statistics and probability are not intuitive
- We tend to jump to conclusions and we are very often wrong
- Transferable skills
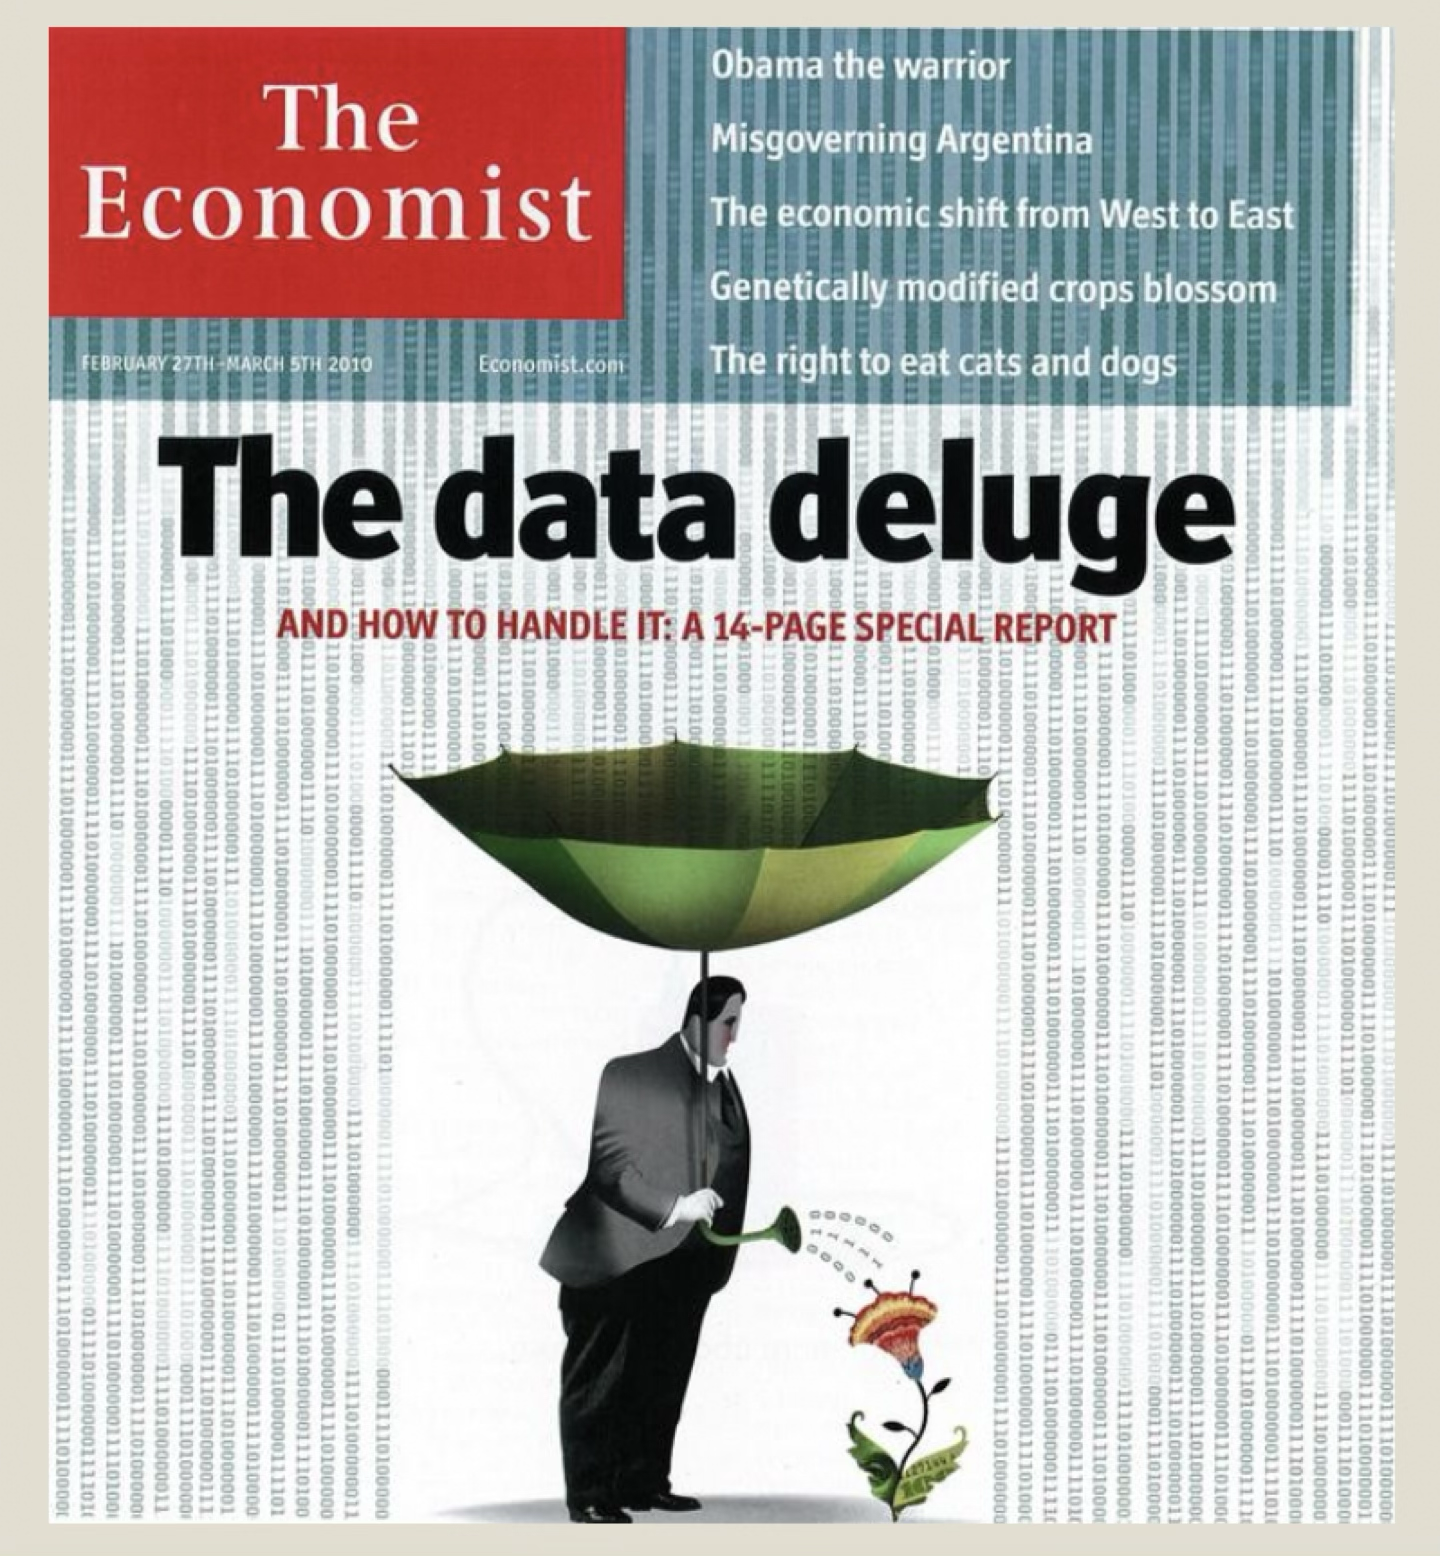
Challenge: data deluge
![Cover of the magazine “The economist”. The heading reads: “The data deluge - And how to handle it: A 14-page special report”. Under the heading is a drawing of a person holding an umbrella in a rainstorm, but the rain is all 1s and 0s. The umbrella top is open but upside-down, collecting water which the person is using to water a plant from the handle of the umbrella.]()
Cover from “The Economist” (Feb 27-March 10, 2010)
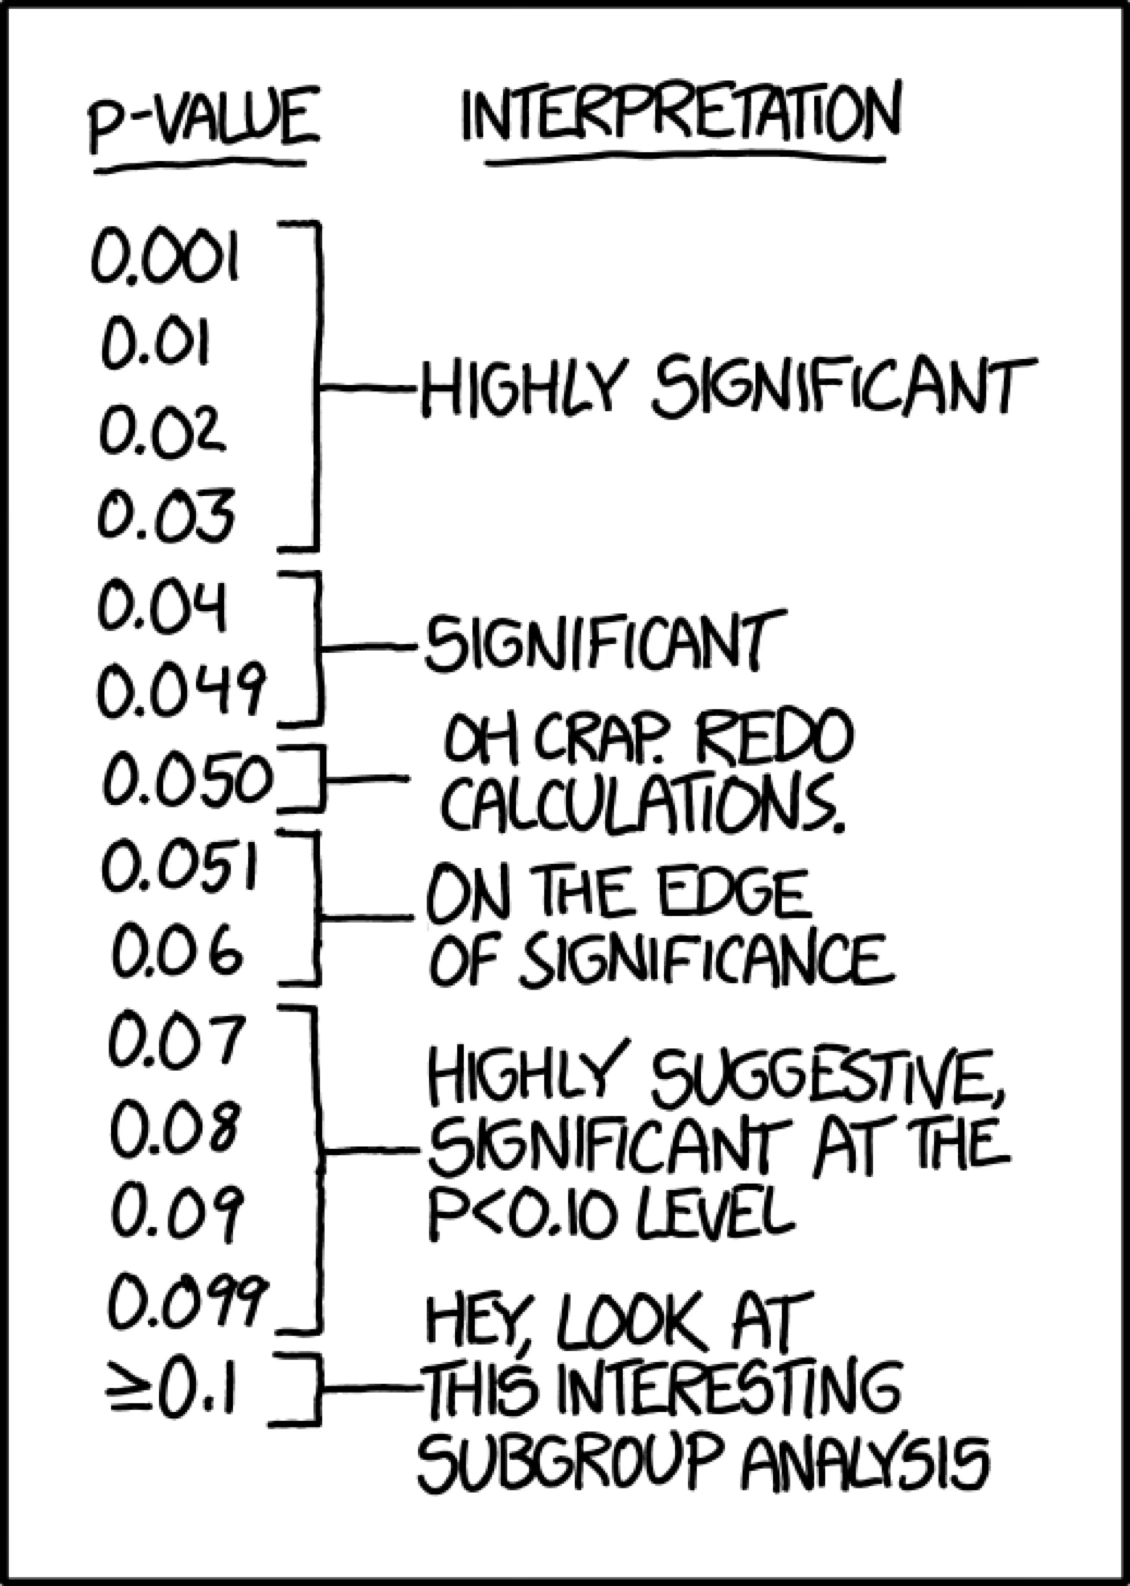
Challenge: understanding
![Comic from xfcd.com: lists p-values ranging from 0.001 to >=0.1 on the left, and on the right offers and interpretation.]()
From: https://xkcd.com/1478/
Goals
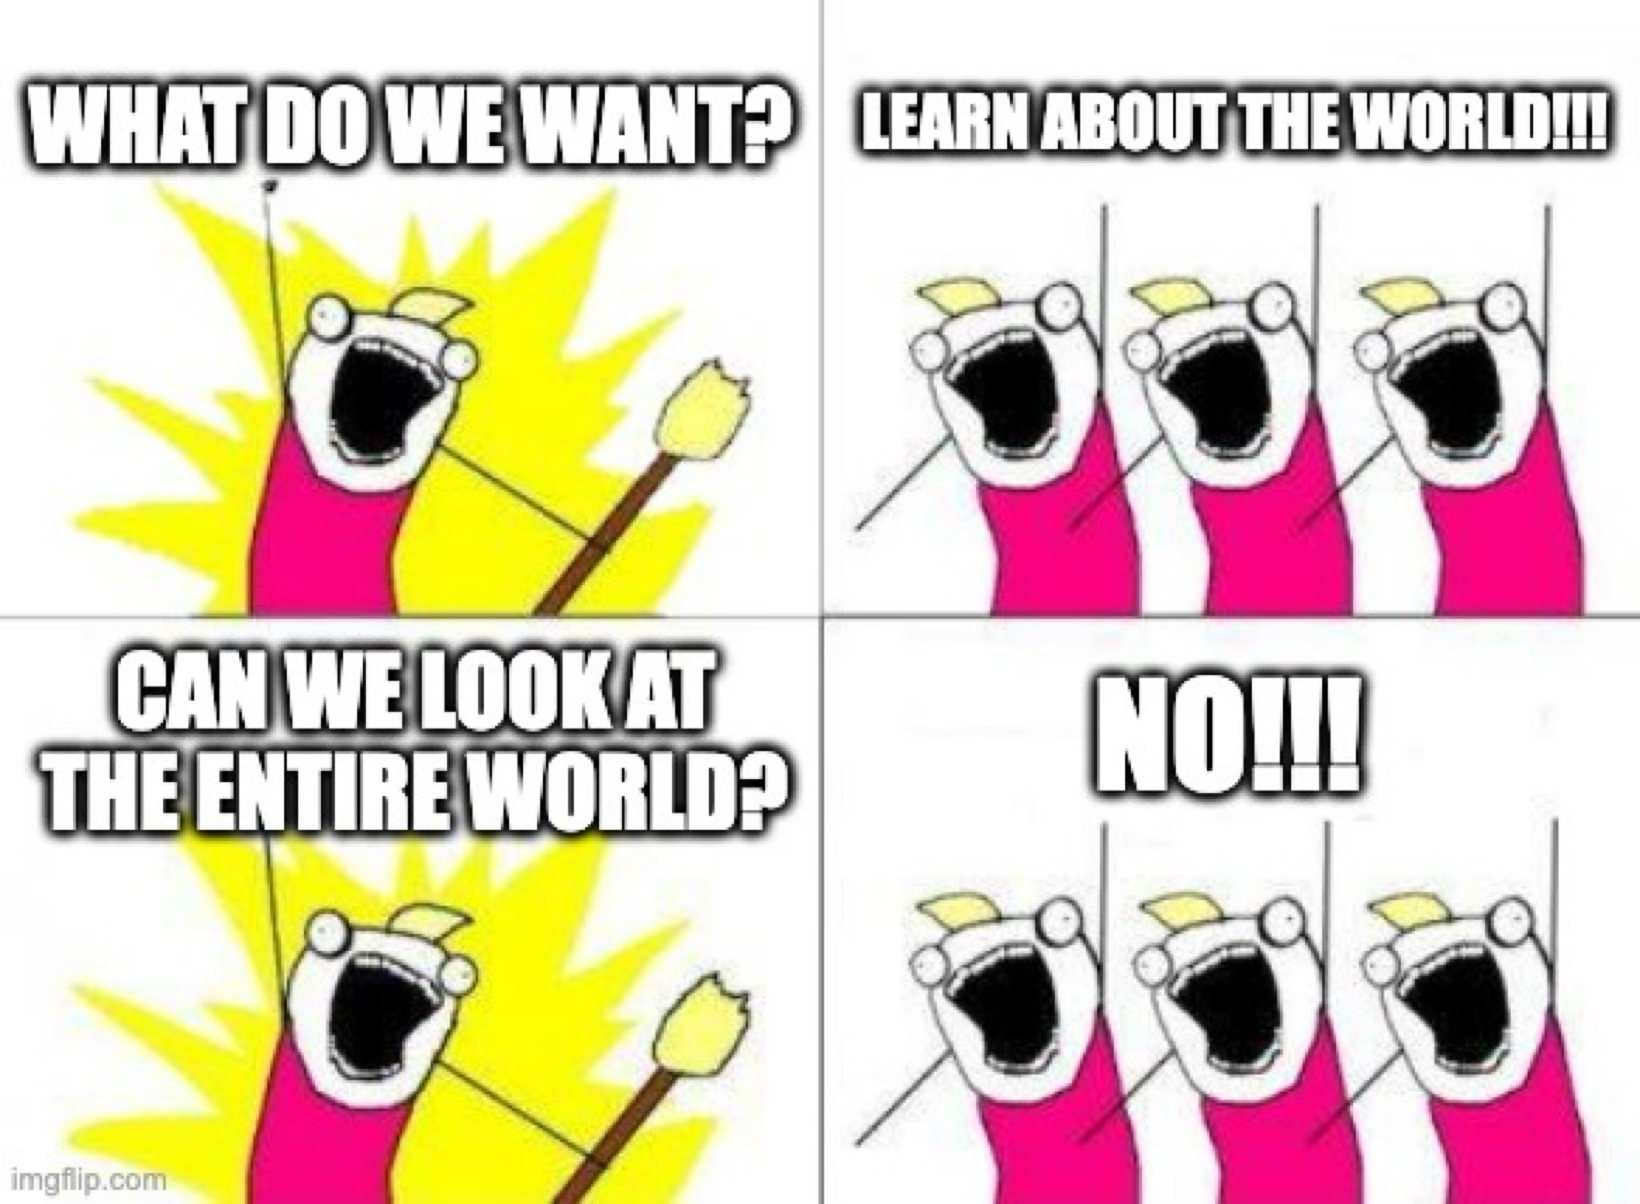
Goal: learn about the world
![Meme from meme generator reads: Question: ”What do we want?”, Response: “Learn about the world!!!”, question: “Can we look at the entire world?”, Response: “No!!!”.]()
From: imgflip.com/memegenerator
Let’s try again
- Statistics are a quantitative technology for empirical science.
- A logic and methodology for the measurement of uncertainty and for an examination of that uncertainty.
- The key word here is uncertainty. Statistics becomes necessary when observations are variable.
What about biostats?
- What is the motivating biological question?
- What experiments can be done and/or data can be collected to address this question?
- Do results support an interesting conclusion?
- What are the shortcomings/limitations of statistical models and causal frameworks in the analysis?
- How do I best communicate my results (including estimates, visualizations, conclusions, and caveats)?
The Central Obsession
- Question: How do we make inferences about the WORLD from our finite observations?
- Answer: Make models to account for the process of sampling and the associated hazards.
Important distinctions
- Populations vs. samples
- Parameters vs. estimates
Populations
In Biology| collection of interbreeding individuals of the same species that live in sufficient proximity that most mates are draw from this collection of individuals. This mostly applies to animals and, to some extent, plants.
In Statistics| the entire collection of individual units that a researcher is interested in. E.g. all women born in the US between 1990 and 200; all polar bears currently living in zoos; users of a certain social network in a certain age group; etc
Statistics & parameters
A parameter is some property of the world, i.e., the “truth”
A population of starfish
- Parameters describe populations
- E.g. proportion of pink starfish among all starfish of a given species in a certain location
A sample of starfish
- Estimates (statistics) approximate parameters as inferred from samples
- We estimate the proportion of pink as inferred from this sample and extrapolate to the population as an approximation.
In summary
Parameters and populations
- Parameters describe Populations
- Because we can’t sample an entire population, we usually don’t know parameters.
Estimates and samples
- But we can get a good sense of the parameters from estimates we make from samples.
- Estimates approximate parameters as inferred from Samples
Sampling: What could go wrong?
Meet sampling error and sampling bias
Sampling bias
- If you collected these against a dark background without careful procedures…
![]()
- This sample is biased. There is a higher proportion of orange stars than the population from which it was taken. Therefore, it is not a representative sample of the underlying population.
![]()
Sampling bias
Systematic difference between parameters & estimates.
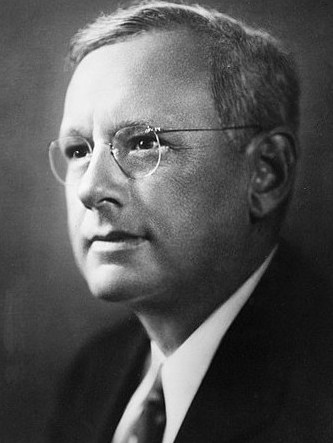
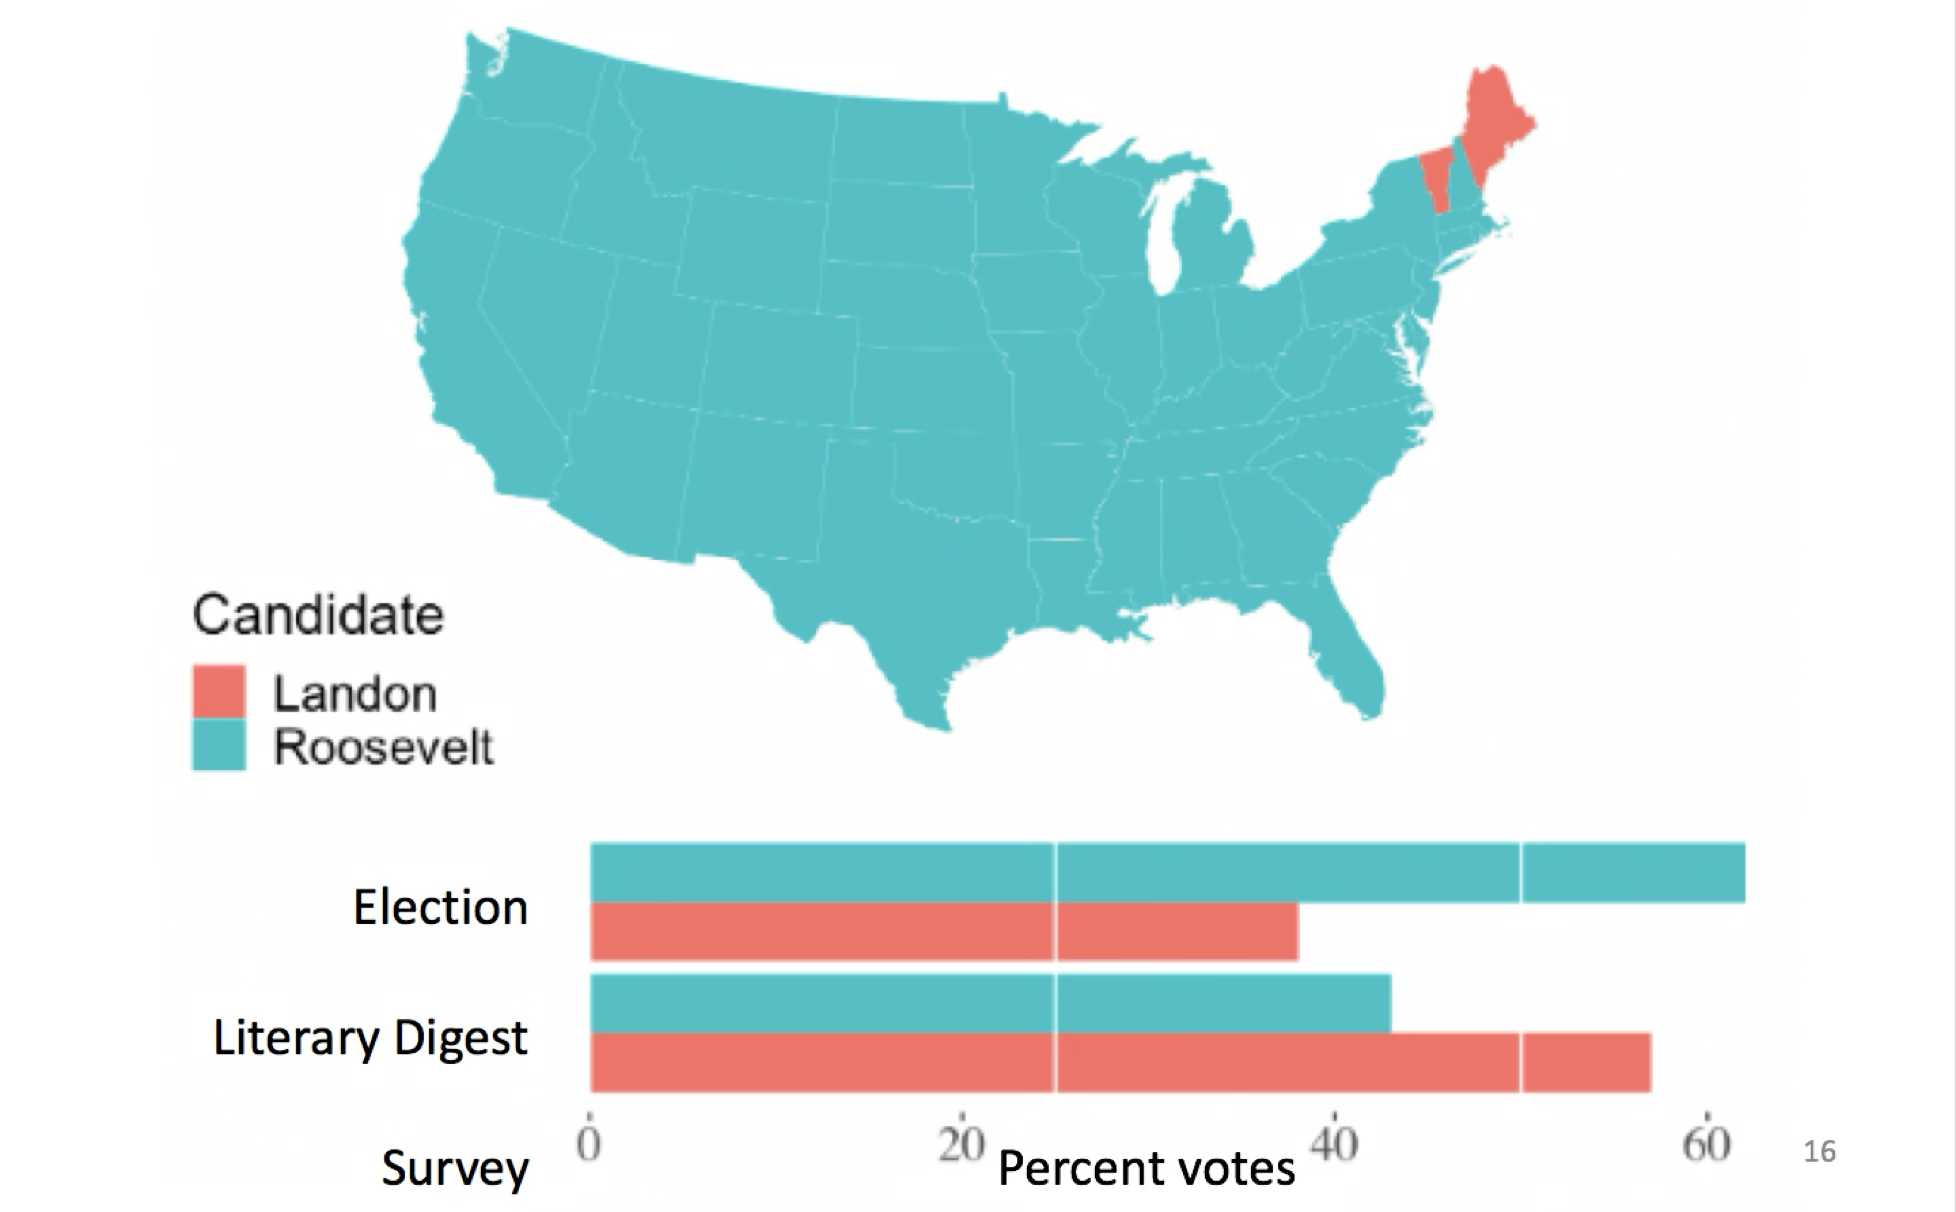
1936 Literary Digest poll
2.4 million responses to 10 million questionnaires , sent to people from telephone books and club lists.
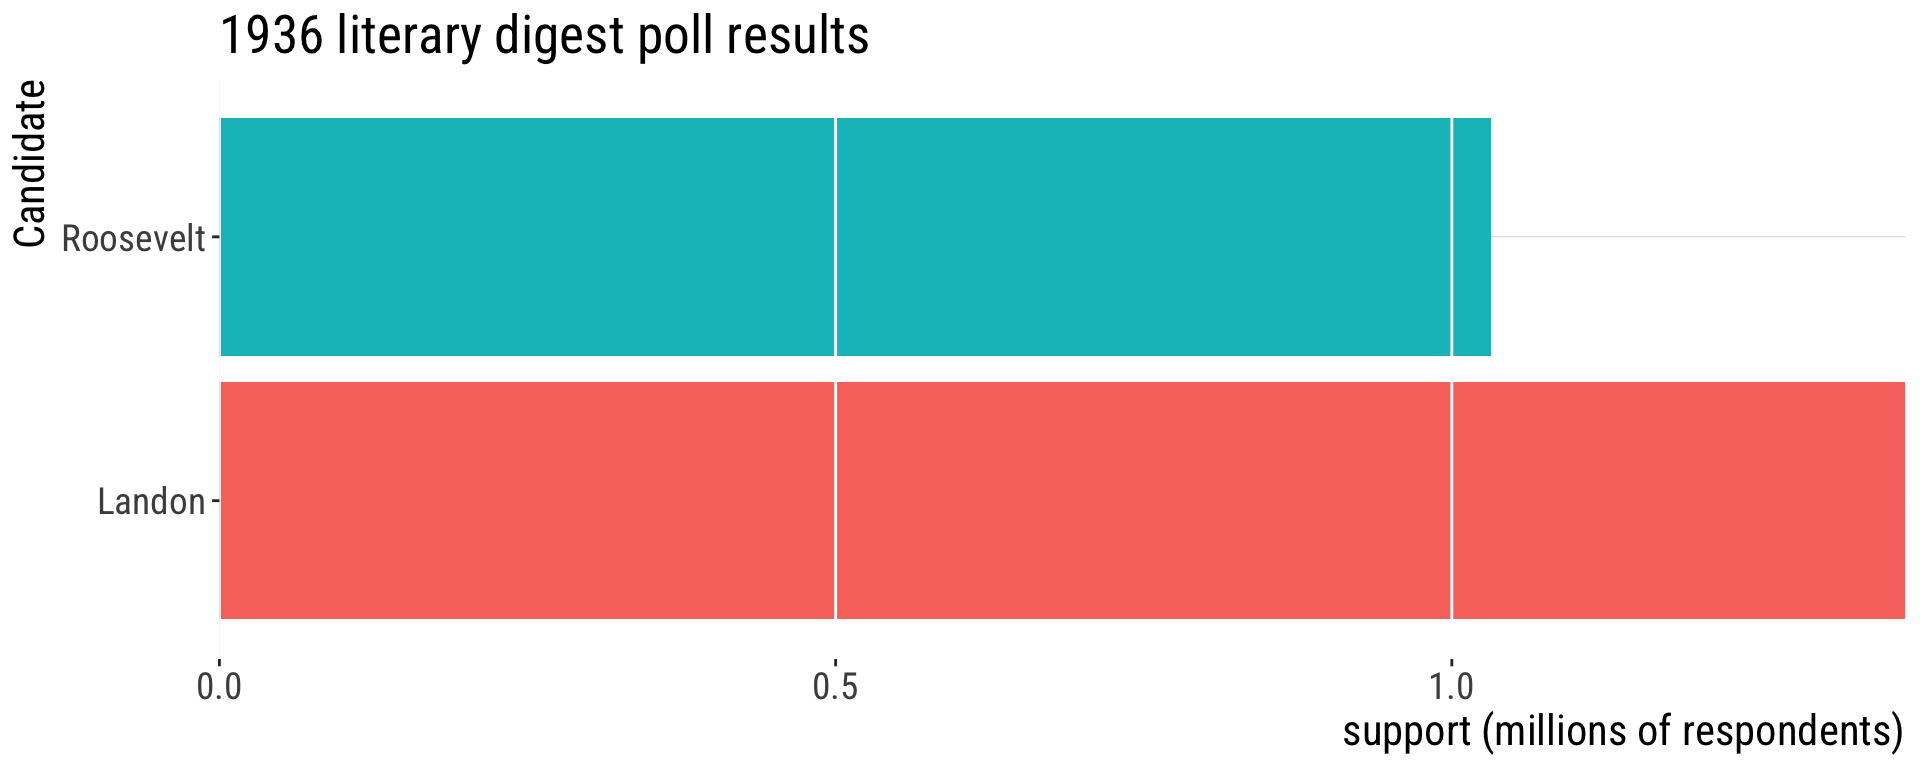
1936 Literary Digest poll
![]()
Figure made in R with code borrowed from Y. Brandvain
Election: Roosevelt won in a landslide
![]()
This plot was made in R
Sampling Bias in the 1936 Polls
- Questionnaire was more likely to reach rich people (who could afford phones & attend book clubs) than those with fewer means.
- Voting and party preference are correlated with wealth.
- Poorer people (underrepresented in the poll) supported Roosevelt, carrying him to victory.
That’s all for today
![Forrest says "And that's all I wanted to say about that"]()
From: makeameme.org