1.2.Statistics and Samples

Bárbara D. Bitarello

2025-09-08

Quick recap

Last lecture we discussed:

  • Population vs. sample
  • Parameter vs. estimate
  • The two types of errors associated with sampling: sampling error and sampling bias

Today

  • Goals of statistics
  • Populations and Samples
  • Statistics and parameters
  • Estimate errors due to sampling
  • Types of experiments
  • Types of variables
  • Types of studies

Learning Goals

  • Understand the major goal of statistics
  • Distinguish between a sample and a population
  • Distinguish between an estimate and a parameter
  • Identify why estimates from samples may deviate from parameters of populations
  • Identify the properties of a good sample
  • Be able to detect the differences between observational and experimental studies

Volunteer bias

Volunteers for a study are likely to be different, on average, from the population. Also known as “self-selection” bias.

For example:

  • Volunteers for sex studies are more likely to be open about sex.
  • In surveys about sexual activity, gender biases answers in opposite directions.
  • Volunteers for medical studies may be sicker than the general population.
  • Animals that are caught may be slower or more docile than those that are not.
  • The case we saw about the 1936 U.S. elections.

Selection bias

[Blondie is standing on a podium behind a lectern with a microphone. She is standing under a hanging sign with large text. In front of the podium is an audience of five seated persons all with their hands raised above their heads. The audience includes two guys that look like Cueball, Hairbun, and two other persons with dark and blonde hair.]     Sign: Statistics Conference 2022     Blondie: Raise your hand if you’re familiar with selection bias.      Blondie: As you can see, it’s a term most people know...

From: https://xkcd.com/2618/. We carefully sampled the general population and found that most people are familiar with acquiescence bias.

Sample of convenience

A sample of convenience is a collection of individuals that happen to be available at the time.

Other definitions1:

A convenience sample is the one that is drawn from a source that is conveniently accessible to the researcher.

A purposive sample is the one whose characteristics are defined for a purpose that is relevant to the study.

Sample of convenience

Problems:

  • “In research, we therefore implicitly seek to generalize the findings from our sample to the entire population, present and future.”1
  • low generalizability. What is true for your sample might not reflect what is true for the population.
  • in practice, you can only generalize findings to the subpopulation from which the sample was taken from.
  • sometimes, a sample of convenience is the best option researchers have (e.g. studies that extract data from national healthcare or insurance databases)
  • It is rarely possible to draw a truly random sample from the population

This does not invalidate the studies in question. They can have high “internal validity”. The issue is with generalizing, i.e, its external validity.

What about sampling error?

Sampling error: Chance deviations between estimates and the truth.

Even when you did NOTHING wrong.

Sampling error is the difference between the estimate and its true parameter value — and it can be quantified!

Example of sampling error

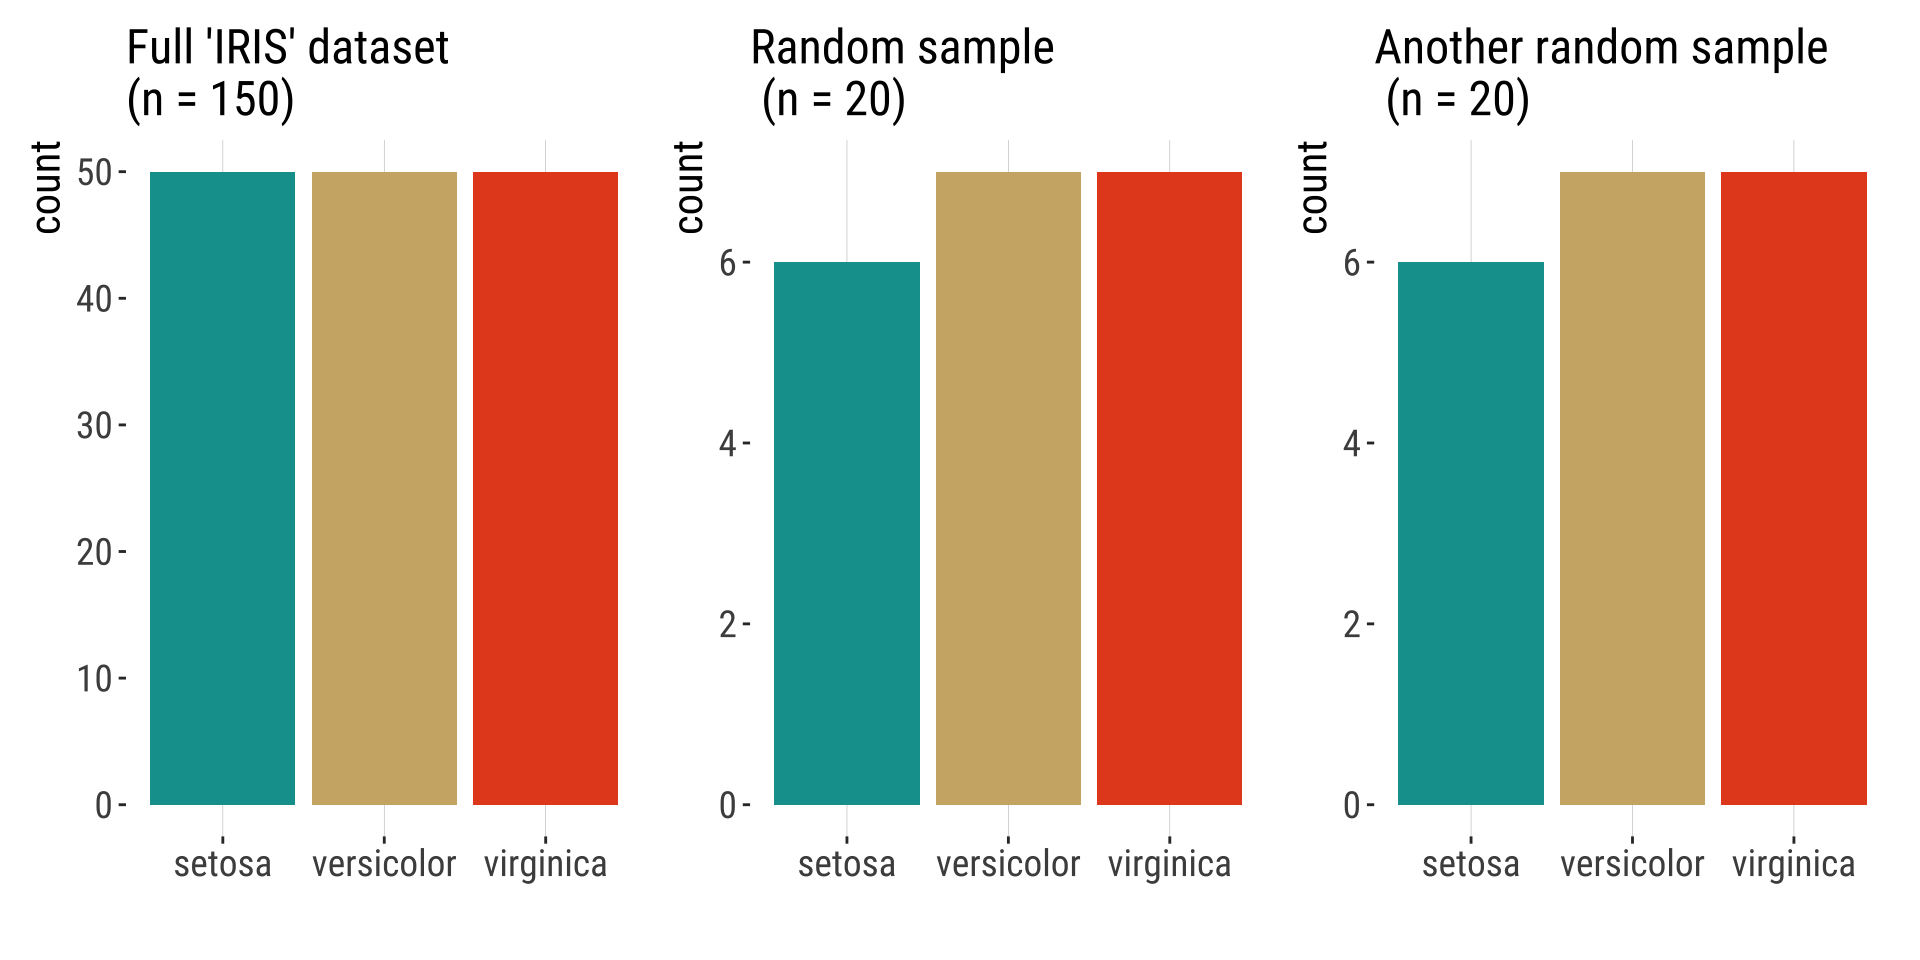
Sampling error declines with sample size

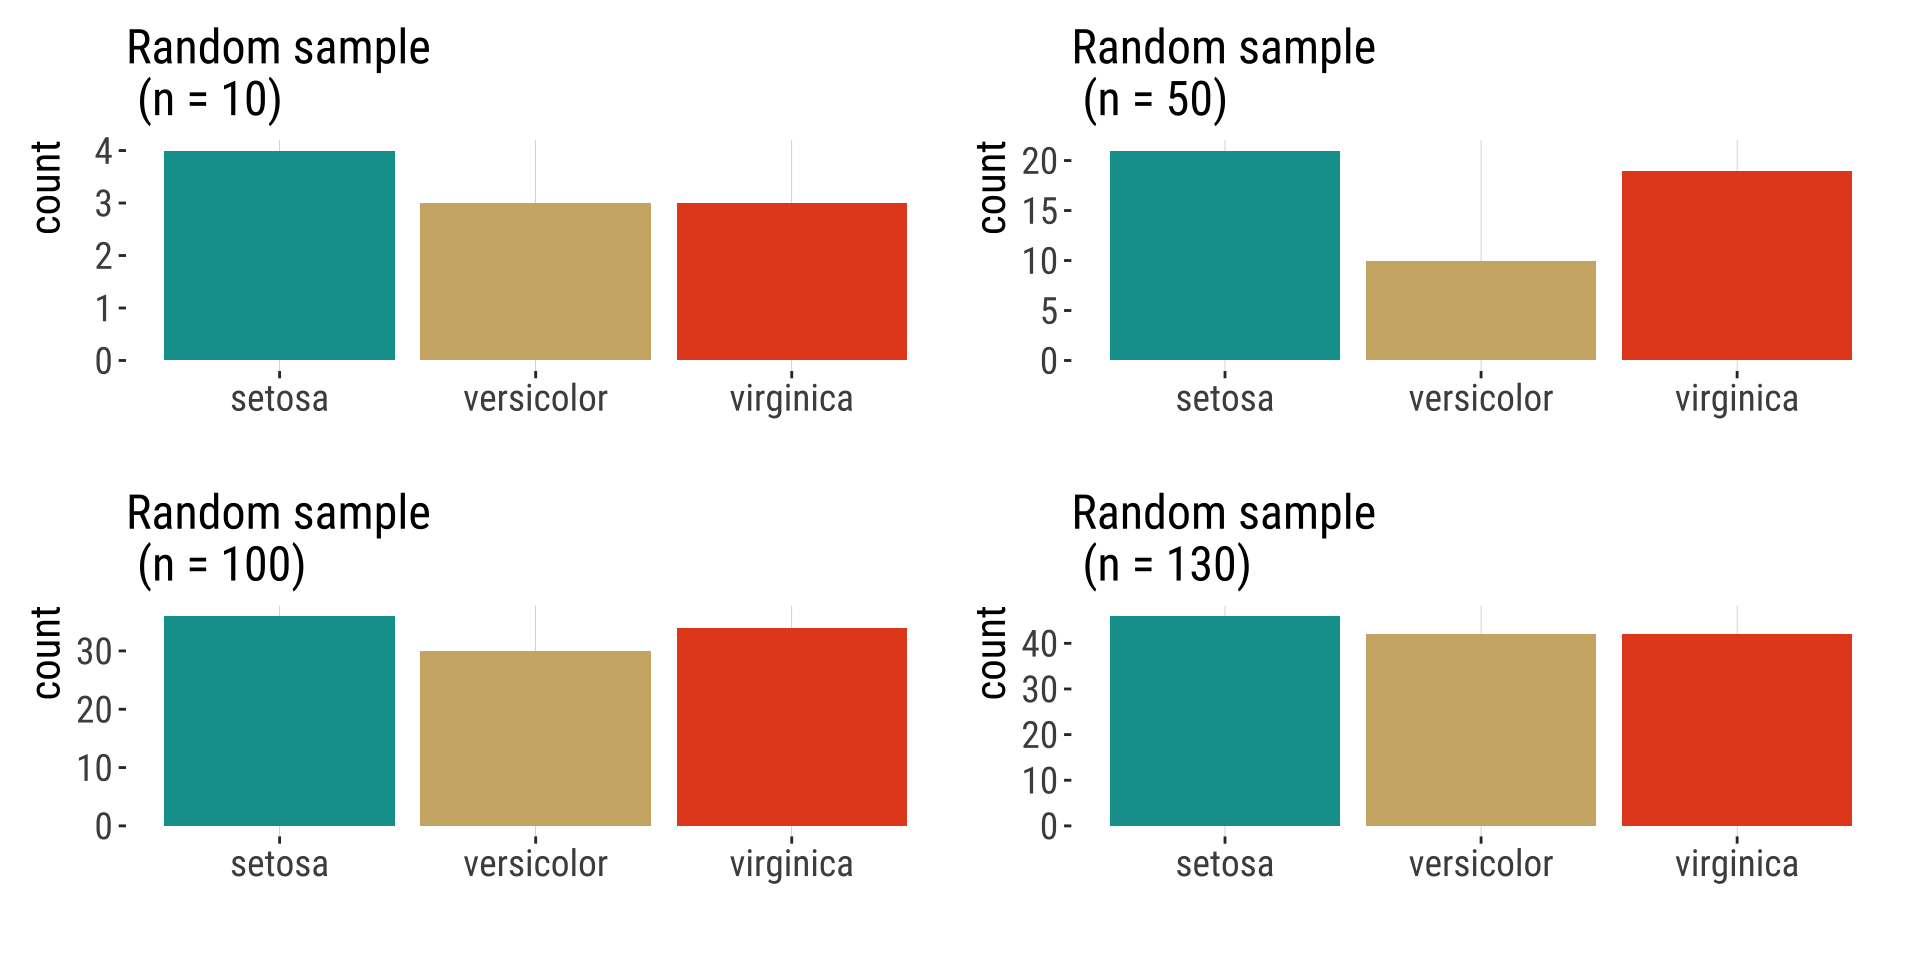
Estimates are random variables

  • Because an estimate is a random variable, the value of an estimate is influenced by chance.

  • Therefore estimates will differ among random samples from the same population.

How bias and sampling error affect estimates

Sampling Bias

  • Systematic difference between estimates & parameters.
  • Driven by bias in the sampling process (i.e., sample not random in relation to the population of interest), regarless of sample size.

Sampling Error

  • Undirected deviation of estimates away from parameters.
  • Driven by chance.
  • Decreases with sample size.

Goals of estimation

Accuracy (on average gets the correct answer)

Precision (gives a similar answer repeatedly)

Left: low accuracy due to low precision. Shot grouping shows four hits around the central circle, somewhat equi-distant from each other. right: low accuracy even with high precision. Shot grouping with four shots near each other to the left-bottom of the center of the central target.

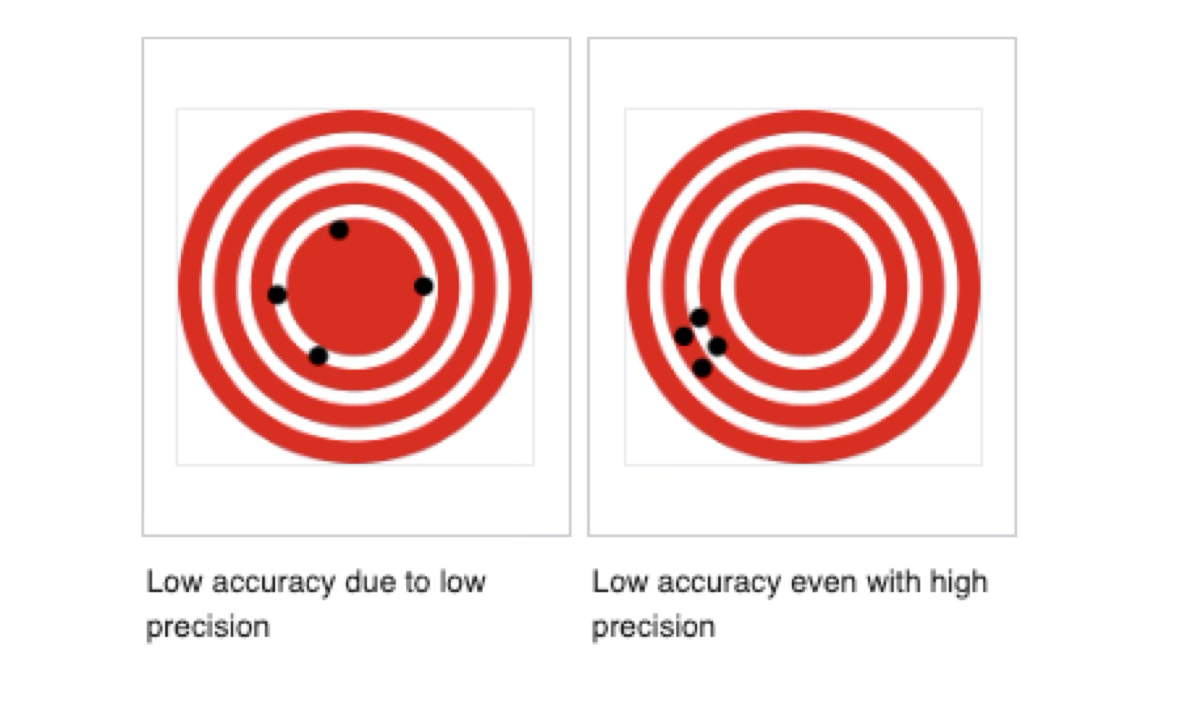
Image: Wikipedia Commons (public domain).

Sampling error vs. bias

In this figure, the “X” is the population parameter. The circles are different estimates calculated from different samples taken from that population.

top left: all estimates are near each other and enar the bulls eye, so they are unbiased and precise; top right: all samples near each other but far from the bulls eye, so they are precise but also biased; bottom left, estimates are scattered 'randomly' around bulls eye, so they are unbiased but also imprecise; bottom right, samples are scattered around acenter that is not the bulls eye, so they are imprecise and biased.

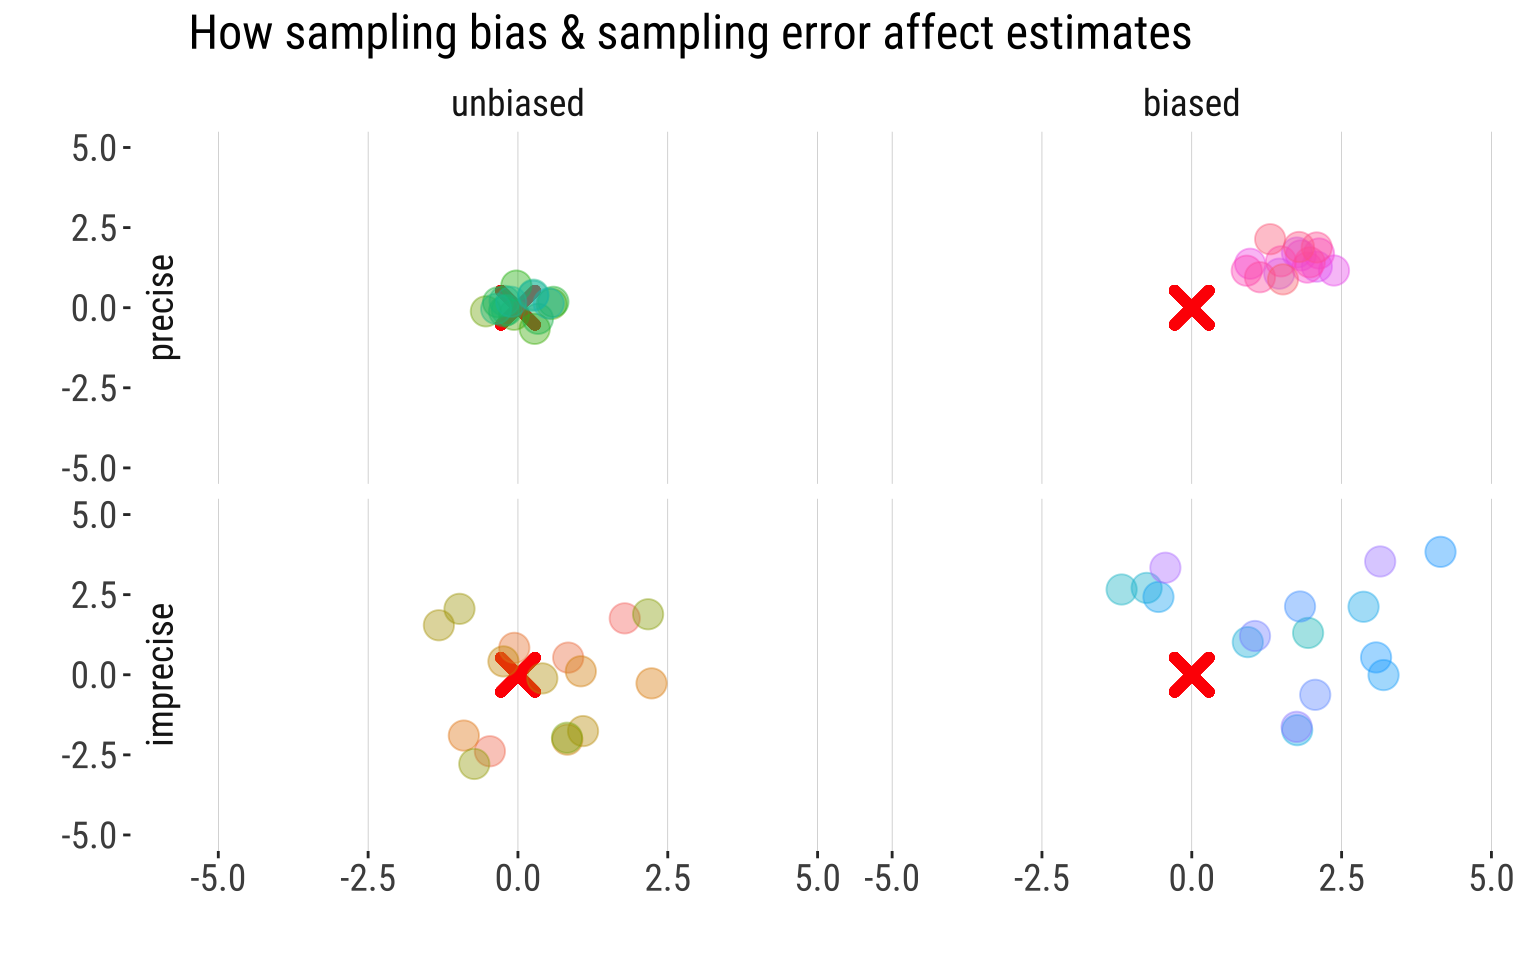
Figure made in R with code borrowed from Y. Brandvain
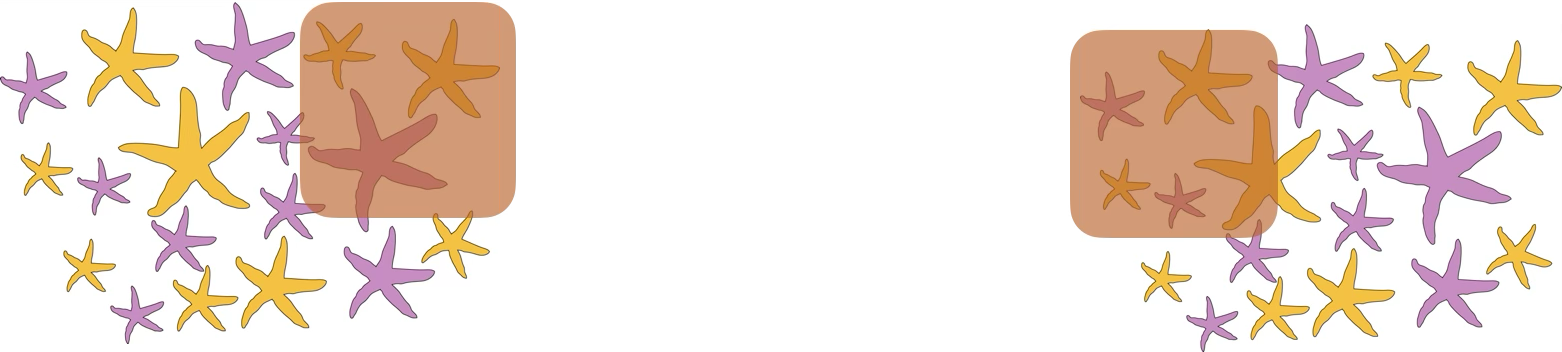
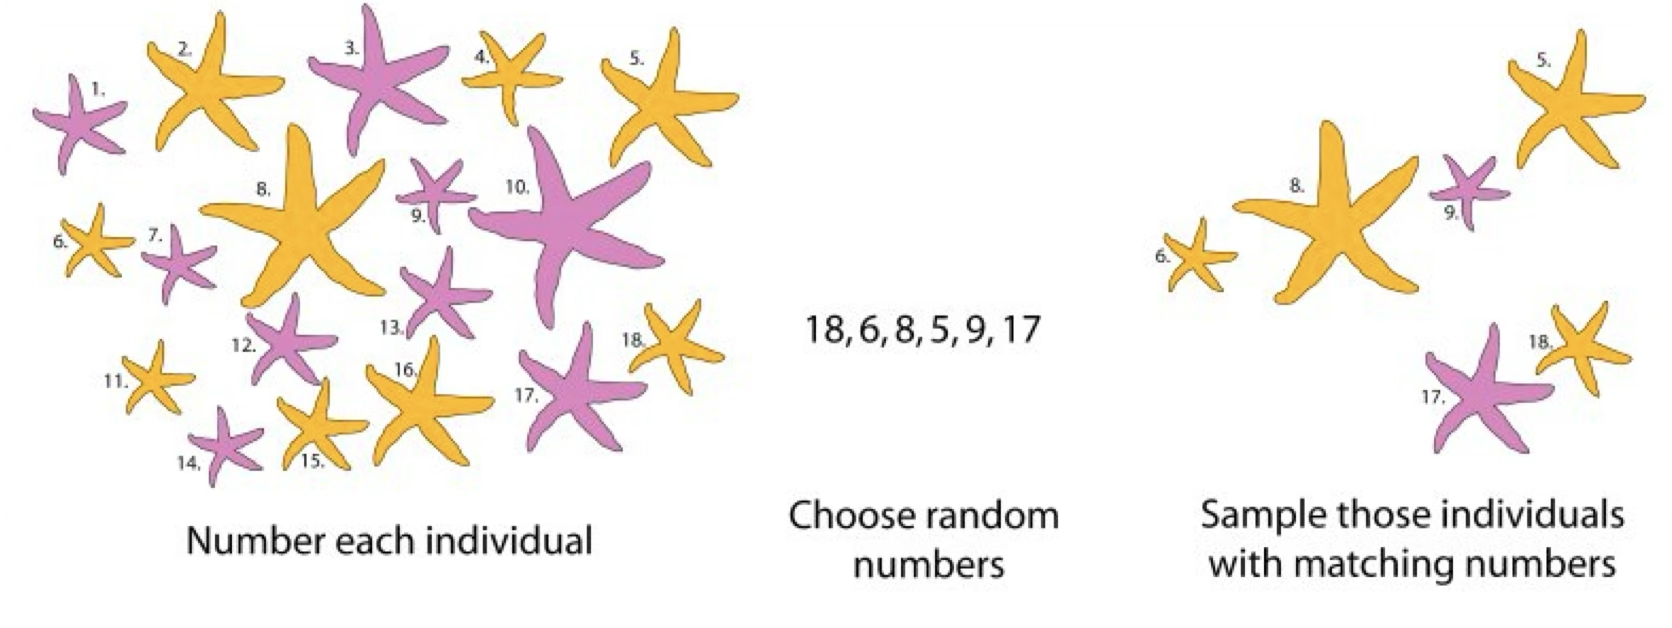
Properties of a good sample

Independent selection of individuals

  • no influence of sampling one individual on other individuals that get sampled.

Random selection of individuals

  • each member of a population has an equal and independent chance of being selected
  • equality: probability of being selected reflects its representation in the population

Sufficiently large

  • What is the point of each of these principles in terms of sampling error and bias and accuracy and precision?

Random samples

Taking random samples is hard and requires effort

  • Why are they important? Reduce sampling bias
  • How to get a random sample (ideal):
  • Carefully characterize a population and use computer code to select participants randomly.

That’s all for today

Forrest says "And that's all I wanted to say about that"

From: makeameme.org