1.3.Statistics and Samples

Bárbara D. Bitarello

2025-09-10

Quick recap

Last lecture we discussed:

  • The two types of errors associated with sampling: sampling error and sampling bias
  • Properties of a good sample

Today

  • Types of variables
  • Types of studies
  • Correlation vs. Causation

How do we choose random numbers? It’s actually really hard!

  • Here is random number generator, where the randomness comes from atmospheric noise https://www.random.org/integers/
  • In practice, for most statistical purposes, pseudo-random numbes are good enough and what we usually get with “random sampling functions” in R.

Random sampling in R

  • Actually pseudo-random
  • If you run the code below, it is very unlikely you will get the same numbers I did
# Sample 3 random numbers between 1 and 10 1. Define the numbers from which you
# will sample
x <- c(1, 2, 3, 4, 5, 6, 7, 8, 9, 10)
# 2. Take 3 random numbers from this set
sample(x, size = 3)
[1]  2  1 10
# now, to convince yourself, do it again
sample(x, size = 3)
[1]  8  7 10

Random sampling in R

  • But you can actually make this reproducible!
  • How? Setting a seed!
  • If you run the code below with the same seed you should get the same numbers I did
# Sample 3 random numbers between 1 and 10 1. Define the numbers from which you
# will sample
x <- c(1, 2, 3, 4, 5, 6, 7, 8, 9, 10)
# 2. Set seed
set.seed(1985)  #the seed can be any number.
# 3. Take 3 random numbers from this set
sample(x, size = 3)
[1] 2 3 6
# now, to convince yourself, do it again
set.seed(1985)
sample(x, size = 3)
[1] 2 3 6

Types of Variables

Variables and “Data”

A variable is a characteristic measured on individuals drawn from a population under study.

Data are measurements of one or more variables made on a collection of individuals. (i.e., your sample)

[Cueball reading off a smart phone to someone off-screen.]     Cueball: According to this polling data, after Kirk and Picard, the most popular Star Trek character are Data.     Off-screen voice: Augh!     [Caption below the frame:]     Annoy grammar pedants on all sides by making "data" singular except when referring to the android.

From: https://xkcd.com/1429. If you want to have more fun at the expense of language pedants, try developing an hypercorrection habit.

Types of variables/data

Numeric (also known as quantitative)

  • Discrete: can be counted
  • Continuous: can be measured

Categorical (also known as class or nominal variables)

  • Ordinal: can be ranked
  • Nominal: cannot be ranked

Numeric Data/Variables

Discrete: can only take some values within acceptable interval

Examples:

  • Number of limbs
  • Number of offspring
  • Number of petals
  • Number of teeth
  • Natural numbers: \(\{0,1,2,3,4,5,6,7,...,\infty\}\)

Numeric Data/Variables

Continuous: Can take any value within acceptable interval

Examples:

  • Arm length (cm, inches)
  • Height (cm, inches)
  • Weight (kg, lbs)
  • Age and longevity (in years, months, etc.)
  • Tail length (cm, inches)
  • Dose (e.g., in micrograms/gram)
  • Skin color (measured using a reflectometer, measure in wavelengths)

Categorical variables

Examples:

  • Genotype (e.g., AA, AG, GG)
  • Drug treatment (e.g. aspirin vs.ibuprofen)
  • Province of origin
  • Survival status (i.e., live or die)
  • Skin/fur/coat/feather color (e.g., black, yellow, red, etc.)

Relationships between variables

We predict the values of response variables from explanatory variables.

Outdated nomenclature: dependent and independent variables

Case Study: surviving the Titanic

Confession: I watched this EIGHT times in the movie theater!

Case Study: surviving the Titanic

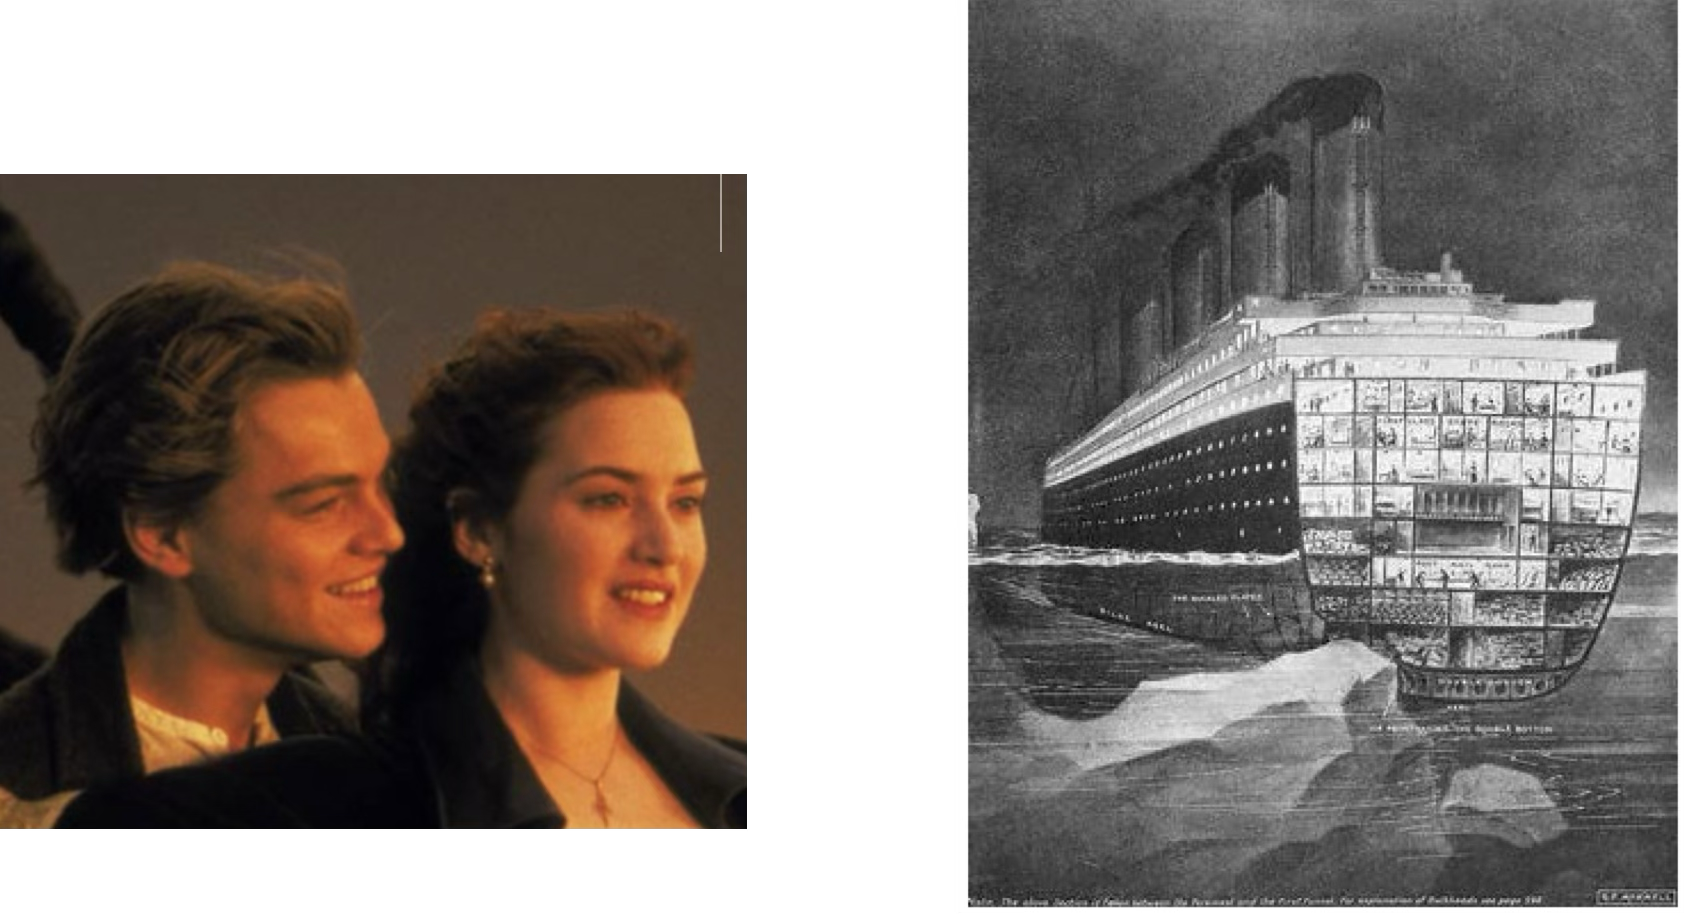
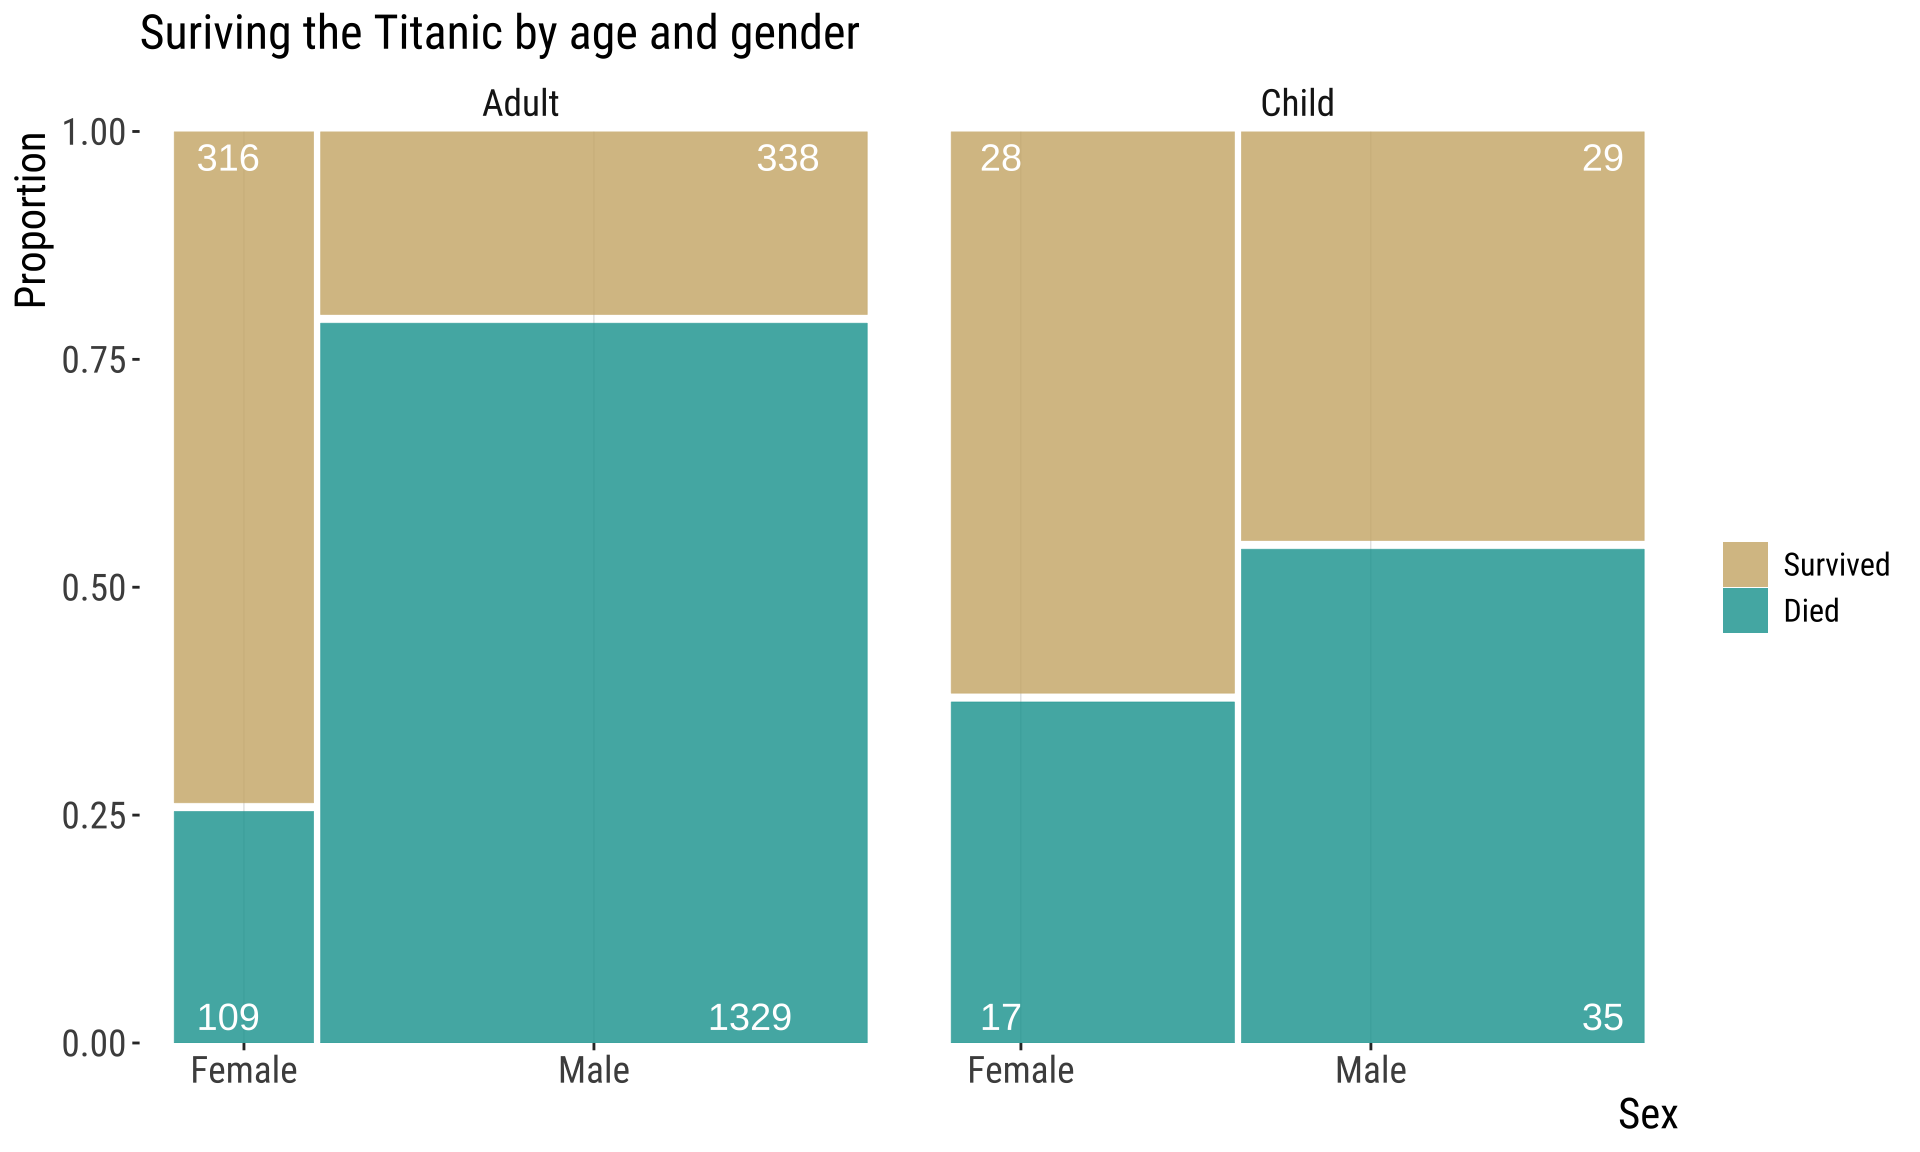
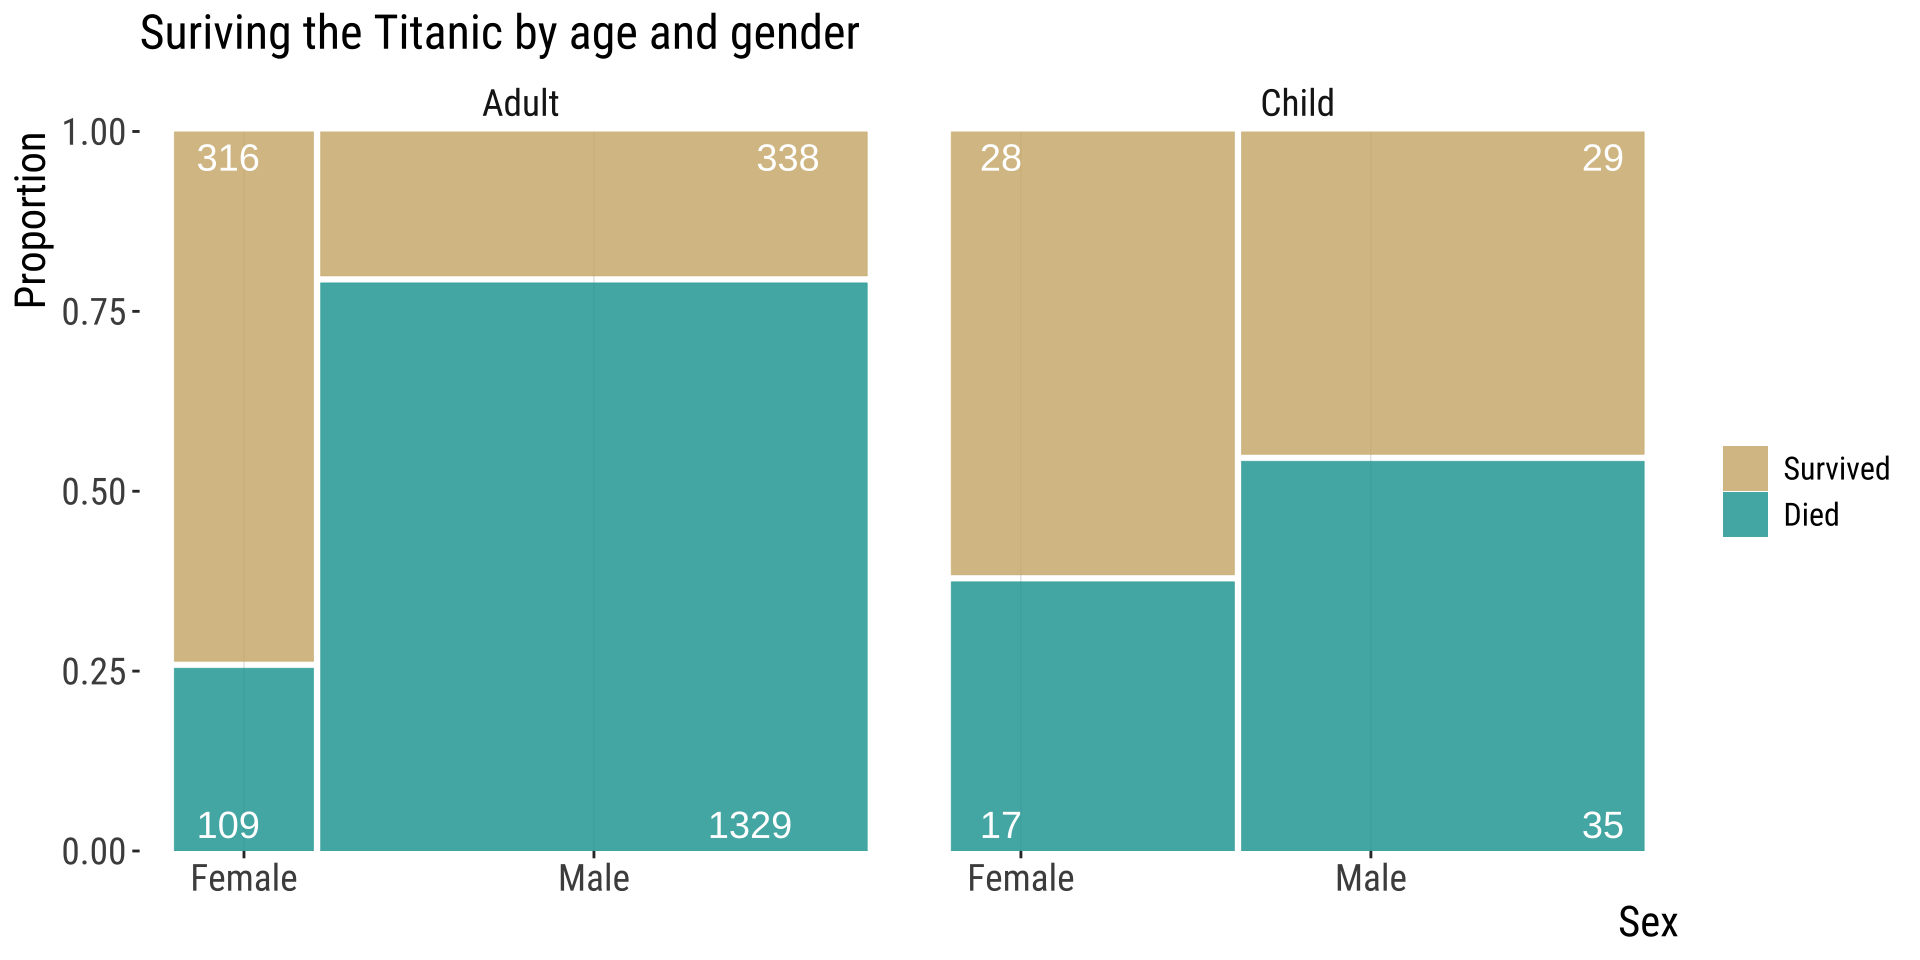
Consider the fate of the approximatley 2,200 passengers of the titanic, including children and adults of both sexes.

Left, proportion of males and females among adults in the titanic who survived.  Right, same thing but for children.

This is a mosaic plot. We will learn about it in our next topic. Code based on snippets from Y. Brandvain.

Discuss

  1. Variables? Types? Explanatory & response variables?

  2. Describe the population this result came from…

  3. How far would you generalize from this to “Women & Children 1st?”

  4. Experimental or observational study?

Experimental vs. Observational Studies

In Experimental Studies, researchers assign treatments to individuals.

  • Big advantage: possibility to conduct randomization (random assignment of treatments to units)
  • Why is this important?

In Observational Studies, researchers do not assign treatments to individuals.

  • But often this is the only source of data available

Correlation DOES NOT imply causation

But it can, of course, suggest it

Because researchers do not assign treatments in observational studies, observations cannot prove causation or disentangle cause and effect.

[    [Cueball is talking to Megan.]     Cueball: I used to think correlation implied causation. [Cueball lift his hand while continuing to talk to Megan.] Cueball: Then I took a statistics class. Now I don't. [Back to the same situation as the first frame.] Megan: Sounds like the class helped. Cueball: Well, maybe.]

From: https://www.xkcd.com/552/. Correlation doesn’t imply causation, but it does waggle its eyebrows suggestively and gesture furtively while mouthing ‘look over there’.

Case Study

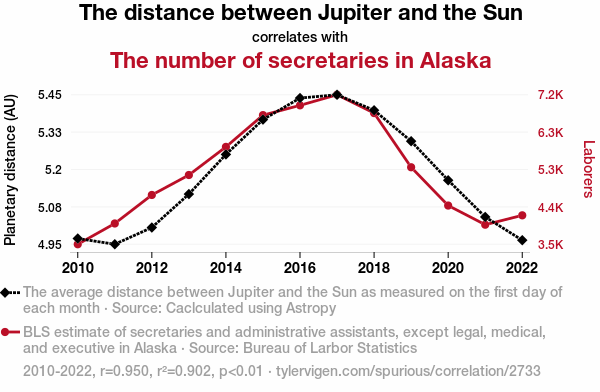
The distance between jupiter and the sun correlates with the number of secretaries in-alaska

From: https://tylervigen.com/spurious/correlation/2733_the-distance-between-jupiter-and-the-sun_correlates-with_the-number-of-secretaries-in-alaska

As the distance between Jupiter and the Sun increases, the gravitational pull on Earth fluctuates, leading to a rise in cosmic productivity waves. These waves, when they reach Alaska, have been found to have a magnetic effect on the influx of secretarial energy, prompting more individuals to pursue careers in Alaska as professional secretaries. It’s like a celestial calling for secretarial excellence in the land of the midnight sun.

That’s all for today

Forrest says "And that's all I wanted to say about that"

From: makeameme.org